Radio Shack 2009 Annual Report Download - page 33
Download and view the complete annual report
Please find page 33 of the 2009 Radio Shack annual report below. You can navigate through the pages in the report by either clicking on the pages listed below, or by using the keyword search tool below to find specific information within the annual report.-
 1
1 -
2
-
3
-
4
-
5
-
6
-
7
-
8
-
9
-
10
-
11
-
12
-
13
-
14
-
15
-
16
-
17
-
18
-
19
-
20
-
21
-
22
-
 23
23 -
 24
24 -
 25
25 -
 26
26 -
 27
27 -
 28
28 -
 29
29 -
 30
30 -
 31
31 -
 32
32 -
 33
33 -
 34
34 -
 35
35 -
 36
36 -
 37
37 -
 38
38 -
 39
39 -
 40
40 -
 41
41 -
 42
42 -
 43
43 -
44
-
45
-
46
-
47
-
48
-
49
-
50
-
51
-
52
-
53
-
54
-
55
-
56
-
57
-
58
-
59
-
60
-
61
-
62
-
63
-
64
-
65
-
66
-
67
-
68
-
69
-
70
-
71
-
72
-
73
-
74
-
75
-
76
-
77
-
78
-
79
-
80
-
81
-
82
-
83
-
84
-
85
-
86
-
87
-
88
-
89
-
90
-
91
-
92
-
93
-
94
-
95
-
96
-
97
 |
 |

26
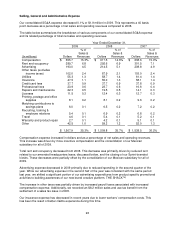
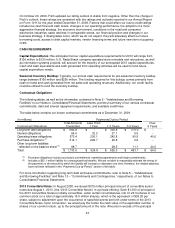
Selling, General and Administrative Expense
Our consolidated SG&A expense decreased 0.1% or $1.9 million in 2009. This represents a 40 basis
point decrease as a percentage of net sales and operating revenues compared to 2008.
The table below summarizes the breakdown of various components of our consolidated SG&A expense
and its related percentage of total net sales and operating revenues.
Year Ended December 31,
2009 2008 2007
% of % of % of
Sales & Sales & Sales &
(In millions) Dollars Revenues Dollars Revenues Dollars Revenues
Compensation $ 655.7 15.3% $ 617.5 14.6% $ 638.6 15.0%
Rent and occupancy 289.7 6.8 292.6 6.9 301.5 7.1
Advertising 193.0 4.5 214.5 5.1 208.8 4.9
Other taxes (excludes
income taxes)
102.0
2.4
87.9
2.1
103.0
2.4
Utilities 55.3 1.3 58.7 1.4 61.4 1.4
Insurance 47.5 1.1 55.0 1.3 58.1 1.4
Credit card fees 37.7 0.9 37.7 0.9 37.8 0.9
Professional fees 23.9 0.6 23.7 0.6 16.6 0.4
Repairs and maintenance 22.3 0.5 19.5 0.5 14.1 0.3
Licenses 11.5 0.3 12.4 0.3 12.7 0.3
Printing, postage and office
supplies
8.1
0.2
8.1
0.2
9.6
0.2
Matching contributions to
savings plans 6.0 0.1 6.5 0.2 7.2 0.2
Recruiting, training &
employee relations
5.4
0.1
6.9
0.2
6.8
0.2
Travel 4.6 0.1 5.4 0.1 5.2 0.1
Warranty and product repair 2.7 0.1 4.2 0.1 5.1 0.1
Other 42.5 1.0 59.2 1.2 52.0 1.3
$ 1,507.9 35.3% $ 1,509.8 35.7% $ 1,538.5 36.2%
Compensation expense increased in dollars and as a percentage of net sales and operating revenues.
This increase was driven by more incentive compensation and the consolidation of our Mexican
subsidiary for all of 2009.
Total rent and occupancy decreased from 2008. This decrease was primarily driven by reduced rent
related to our amended headquarters lease, discussed below, and the closing of our Sprint-branded
kiosks. These decreases were partially offset by the consolidation of our Mexican subsidiary for all of
2009.
Advertising expense decreased in 2009 primarily due to reduced spending in the second quarter of the
year. While our advertising expense in the second half of the year was consistent with the same period
last year, we shifted a significant portion of our advertising expenditures from product specific promotional
activities to building awareness of our new brand creative platform, THE SHACK™.
The increase in other taxes was partially driven by increased payroll taxes associated with increased
compensation expense. Additionally, we recorded an $8.2 million sales and use tax benefit from the
settlement of a sales tax issue in 2008.
Our insurance expense has decreased in recent years due to lower workers’ compensation costs. This
has been the result of better claims experience during this time.