Radio Shack 2009 Annual Report Download - page 29
Download and view the complete annual report
Please find page 29 of the 2009 Radio Shack annual report below. You can navigate through the pages in the report by either clicking on the pages listed below, or by using the keyword search tool below to find specific information within the annual report.-
 1
1 -
2
-
3
-
4
-
5
-
6
-
7
-
8
-
9
-
10
-
11
-
12
-
13
-
14
-
15
-
16
-
17
-
18
-
 19
19 -
 20
20 -
 21
21 -
 22
22 -
 23
23 -
 24
24 -
 25
25 -
 26
26 -
 27
27 -
 28
28 -
 29
29 -
 30
30 -
 31
31 -
 32
32 -
 33
33 -
 34
34 -
 35
35 -
 36
36 -
 37
37 -
 38
38 -
 39
39 -
40
-
41
-
42
-
43
-
44
-
45
-
46
-
47
-
48
-
49
-
50
-
51
-
52
-
53
-
54
-
55
-
56
-
57
-
58
-
59
-
60
-
61
-
62
-
63
-
64
-
65
-
66
-
67
-
68
-
69
-
70
-
71
-
72
-
73
-
74
-
75
-
76
-
77
-
78
-
79
-
80
-
81
-
82
-
83
-
84
-
85
-
86
-
87
-
88
-
89
-
90
-
91
-
92
-
93
-
94
-
95
-
96
-
97
 |
 |
22
ITEM 7. MANAGEMENT'S DISCUSSION AND ANALYSIS OF FINANCIAL CONDITION AND
RESULTS OF OPERATIONS (“MD&A”).
This MD&A section discusses our results of operations, liquidity and financial condition, risk management
practices, critical accounting policies, and estimates and certain factors that may affect our future results,
including economic and industry-wide factors. Our MD&A should be read in conjunction with our
consolidated financial statements and accompanying notes, included in this Annual Report on Form 10-K,
as well as the Risk Factors set forth in Item 1A above.
OVERVIEW
Highlights related to the year ended December 31, 2009, include:
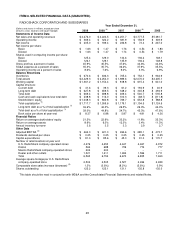
• Net sales and operating revenues increased $51.5 million, or 1.2%, to $4,276.0 million when
compared with last year. Comparable store sales increased 1.3%. This increase was driven
primarily by increased sales in our Sprint Nextel postpaid wireless business, the addition of T-
Mobile as a postpaid wireless carrier in our company-operated stores, increased sales of prepaid
wireless handsets and airtime, increased sales of netbooks, and increased sales of digital
televisions, but was partially offset by sales declines in GPS products, digital-to-analog converter
boxes, wireless accessories, digital music players, batteries, and digital cameras. Consolidated net
sales and operating revenues also benefited from the consolidation of our Mexico subsidiary for all
of 2009.
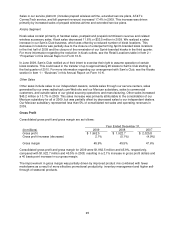
• Gross margin increased 40 basis points to 45.9% from last year. Gross margin was positively
impacted by improved product mix combined with fewer markdowns as a result of more effective
promotional productivity, inventory management and higher sell-through of seasonal products.
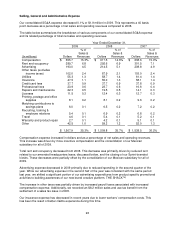
• Selling, general and administrative (“SG&A”) expense decreased $1.9 million when compared with
last year. As a percentage of net sales and operating revenues, SG&A decreased by 40 basis
points to 35.3%. Significant changes within SG&A expense include the full year results of our
Mexican subsidiary, more incentive compensation, and lower advertising expense.
• As a result of the factors above, operating income increased $47.2 million, or 14.6%, to $369.4
million when compared with last year.
• Net income increased $15.6 million to $205.0 million when compared with last year. Net income per
diluted share was $1.63 compared with $1.47 last year.
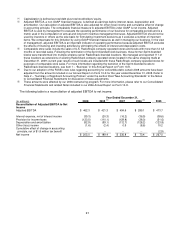
• Adjusted EBITDA increased $41.0 million, or 9.7%, to $462.3 million when compared with last year.