Radio Shack 2009 Annual Report Download - page 36
Download and view the complete annual report
Please find page 36 of the 2009 Radio Shack annual report below. You can navigate through the pages in the report by either clicking on the pages listed below, or by using the keyword search tool below to find specific information within the annual report.-
 1
1 -
2
-
3
-
4
-
5
-
6
-
7
-
8
-
9
-
10
-
11
-
12
-
13
-
14
-
15
-
16
-
17
-
18
-
19
-
20
-
21
-
22
-
23
-
24
-
25
-
 26
26 -
 27
27 -
 28
28 -
 29
29 -
 30
30 -
 31
31 -
 32
32 -
 33
33 -
 34
34 -
 35
35 -
 36
36 -
 37
37 -
 38
38 -
 39
39 -
 40
40 -
 41
41 -
 42
42 -
 43
43 -
 44
44 -
 45
45 -
 46
46 -
47
-
48
-
49
-
50
-
51
-
52
-
53
-
54
-
55
-
56
-
57
-
58
-
59
-
60
-
61
-
62
-
63
-
64
-
65
-
66
-
67
-
68
-
69
-
70
-
71
-
72
-
73
-
74
-
75
-
76
-
77
-
78
-
79
-
80
-
81
-
82
-
83
-
84
-
85
-
86
-
87
-
88
-
89
-
90
-
91
-
92
-
93
-
94
-
95
-
96
-
97
 |
 |

29
Sales in our modern home platform decreased 6.5% in 2008. This decrease was primarily the result of
declines in sales of DVD players and recorders, cordless telephones, and flat panel televisions, but was
partially offset by increased sales of laptop computers.
Sales in our personal electronics platform decreased 17.5% in 2008. This decrease was driven primarily
by sales declines in digital music players, toys, and satellite radios, but was partially offset by increased
sales of video game consoles.
Sales in our power platform decreased 3.6% in 2008. This decrease was primarily the result of decreased
sales of certain special purpose and general purpose batteries.
Sales in our technical platform decreased 1.4% in 2008.
Sales in our service platform decreased 4.2% in 2008. This decrease was driven primarily by declines in
bill payment revenue and sales of extended service plans, but was partially offset by increased sales of
prepaid wireless airtime.
Kiosks Segment
Kiosk sales decreased 4.5% or $13.5 million in 2008. This sales decrease was driven primarily by a
decline in the number of our Sprint-branded kiosks, but was partially offset by sales gains at our Sam’s
Club kiosks.
Other Sales
Other sales increased $12.9 million or 4.1% in 2008. This sales increase was driven primarily by
increased sales at our RadioShack.com Web site and the recognition of 100% of the sales for
RadioShack de Mexico in the month of December. If we had owned 100% of RadioShack de Mexico for
all of 2008, we would have recognized approximately $100 million in additional net sales and operating
revenues for the year. Sales to independent dealers did not significantly change from 2007.
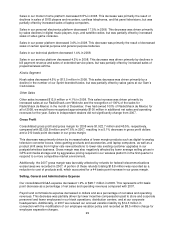
Gross Profit
Consolidated gross profit and gross margin for 2008 were $1,922.7 million and 45.5%, respectively,
compared with $2,025.8 million and 47.6% in 2007, resulting in a 5.1% decrease in gross profit dollars
and a 210 basis point decrease in our gross margin.
This decrease was primarily driven by increased sales of lower margin products such as digital-to-analog
television converter boxes, video gaming products and accessories, and laptop computers, as well as a
product shift away from higher-rate new activations to lower-rate existing customer upgrades in our
postpaid wireless business. Gross margin was also negatively affected by lower average selling prices in
GPS and media storage and by aggressive pricing required in our wireless platform in the first quarter to
respond to a more competitive market environment.
Additionally, the 2007 gross margin was favorably affected by refunds for federal telecommunications
excise taxes we recorded in 2007. A portion of these refunds totaling $18.8 million was recorded as a
reduction to cost of products sold, which accounted for a 44 basis point increase in our gross margin.
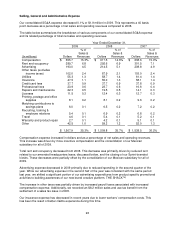
Selling, General and Administrative Expense
Our consolidated SG&A expense decreased 1.9% or $28.7 million in 2008. This represents a 50 basis
point decrease as a percentage of net sales and operating revenues compared with 2007.
Payroll and commissions expense decreased in dollars and as a percentage of net sales and operating
revenues. This decrease was partially driven by lower incentive compensation paid to store and corporate
personnel and fewer employees in our kiosk operations, distribution centers, and at our corporate
headquarters. Additionally, in 2007 we reduced our accrued vacation liability by $14.3 million in
connection with the modification of our employee vacation policy and recorded an $8.5 million charge for
employee separation charges.