Radio Shack 2009 Annual Report Download - page 77
Download and view the complete annual report
Please find page 77 of the 2009 Radio Shack annual report below. You can navigate through the pages in the report by either clicking on the pages listed below, or by using the keyword search tool below to find specific information within the annual report.-
 1
1 -
2
-
3
-
4
-
5
-
6
-
7
-
8
-
9
-
10
-
11
-
12
-
13
-
14
-
15
-
16
-
17
-
18
-
19
-
20
-
21
-
22
-
23
-
24
-
25
-
26
-
27
-
28
-
29
-
30
-
31
-
32
-
33
-
34
-
35
-
36
-
37
-
38
-
39
-
40
-
41
-
42
-
43
-
44
-
45
-
46
-
47
-
48
-
49
-
50
-
51
-
52
-
53
-
54
-
55
-
56
-
57
-
58
-
59
-
60
-
61
-
62
-
63
-
64
-
65
-
66
-
 67
67 -
 68
68 -
 69
69 -
 70
70 -
 71
71 -
 72
72 -
 73
73 -
 74
74 -
 75
75 -
 76
76 -
 77
77 -
 78
78 -
 79
79 -
 80
80 -
 81
81 -
 82
82 -
 83
83 -
 84
84 -
 85
85 -
 86
86 -
 87
87 -
88
-
89
-
90
-
91
-
92
-
93
-
94
-
95
-
96
-
97
 |
 |

70
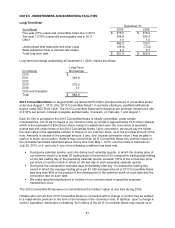
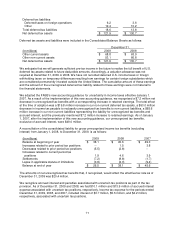
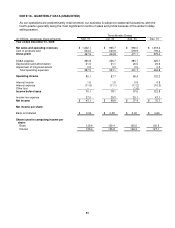
NOTE 9 - INCOME TAXES
The following is a reconciliation of the federal statutory income tax rate to our income tax expense:
Year Ended December 31,
(In millions) 2009 2008 2007
Components of income from
continuing operations:
United States $ 326.4 $ 289.6 $ 357.4
Foreign 2.1 9.9 9.2
Income before income taxes 328.5 299.5 366.6
Statutory tax rate x 35.0% x 35.0% x 35.0%
Federal income tax ex
p
ense at statutor
y
rate 115.0 104.8 128.3
State income taxes, net of federal benefit 9.2 8.4 9.2
Unrecognized tax benefits (3.1) 2.3 (2.5)
Other, net 2.4 (5.4) (5.2)
Total income tax ex
p
ense $ 123.5 $ 110.1 $ 129.8
Effective tax rate 37.6% 36.8% 35.4%
The components of income tax expense were as follows:
Year Ended December 31,
(In millions) 2009 2008 2007
Current:
Federal $ 105.3 $ 92.2 $ 99.3
State 7.1 14.0 13.0
Foreign 2.6 (7.8) 1.0
115.0 98.4 113.3
Deferred:
Federal 8.6 8.9 12.4
State 0.2 2.8 4.1
Foreign (0.3) -- --
8.5 11.7 16.5
Income tax expense $ 123.5 $ 110.1 $ 129.8
The tax effect of cumulative temporary differences that gave rise to the deferred tax assets and liabilities
were as follows:
December 31,
(In millions) 2009 2008
Deferred tax assets:
Depreciation and amortization $ 22.9 $ 27.3
Insurance reserves 18.0 20.4
Reserve for estimated wireless service
deactivations
14.1
8.9
Deferred compensation 13.6 14.0
Indirect effect of unrecognized tax benefits 10.1 15.7
Accrued average rent 8.7 10.6
Deferred revenue 7.9 12.3
Convertible debt original issue discount 2.5 3.0
Other 42.7 32.3
Total deferred tax assets 140.5 144.5