Radio Shack 2009 Annual Report Download - page 30
Download and view the complete annual report
Please find page 30 of the 2009 Radio Shack annual report below. You can navigate through the pages in the report by either clicking on the pages listed below, or by using the keyword search tool below to find specific information within the annual report.-
 1
1 -
2
-
3
-
4
-
5
-
6
-
7
-
8
-
9
-
10
-
11
-
12
-
13
-
14
-
15
-
16
-
17
-
18
-
19
-
 20
20 -
 21
21 -
 22
22 -
 23
23 -
 24
24 -
 25
25 -
 26
26 -
 27
27 -
 28
28 -
 29
29 -
 30
30 -
 31
31 -
 32
32 -
 33
33 -
 34
34 -
 35
35 -
 36
36 -
 37
37 -
 38
38 -
 39
39 -
 40
40 -
41
-
42
-
43
-
44
-
45
-
46
-
47
-
48
-
49
-
50
-
51
-
52
-
53
-
54
-
55
-
56
-
57
-
58
-
59
-
60
-
61
-
62
-
63
-
64
-
65
-
66
-
67
-
68
-
69
-
70
-
71
-
72
-
73
-
74
-
75
-
76
-
77
-
78
-
79
-
80
-
81
-
82
-
83
-
84
-
85
-
86
-
87
-
88
-
89
-
90
-
91
-
92
-
93
-
94
-
95
-
96
-
97
 |
 |

23
RESULTS OF OPERATIONS
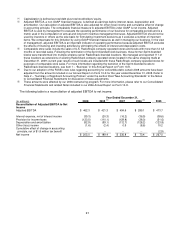
Due to our adoption of the FASB’s new rules regarding accounting for convertible debt, certain 2008
amounts have been adjusted from the amounts included in our Annual Report on Form 10-K for the year
ended December 31, 2008. Refer to Note 2 – “Summary of Significant Accounting Policies” under the
section titled “New Accounting Standards” in the Notes to Consolidated Financial Statements for
discussion of these adjustments.
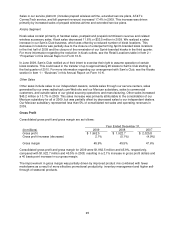
Net Sales and Operating Revenues
Consolidated net sales increased 1.2% or $51.5 million to $4,276.0 million for the year ended December
31, 2009, compared with $4,224.5 million in 2008. This increase was primarily due to a comparable store
sales increase of 1.3% in 2009. The increase in comparable store sales was driven primarily by increased
sales in our wireless and modern home platforms, but was partially offset by decreased sales in our
accessory and personal electronics platforms.
Consolidated net sales and operating revenues for our two reportable segments and other sales are as
follows:
Year Ended December 31,
(In millions) 2009 2008
2007
U.S. RadioShack company-operated stores $ 3,650.9 $ 3,611.1 $ 3,637.7
Kiosks 250.0 283.5 297.0
Other (1) 375.1 329.9 317.0
Consolidated net sales and operating revenues $ 4,276.0 $ 4,224.5 $ 4,251.7
Consolidated net sales and operating
revenues increase (decrease)
1.2%
(0.6%)
(11.0%)
Comparable store sales increase (decrease) (2) 1.3% (0.6%) (8.2%)
(1) Net sales and operating revenues for 2009 include the consolidation of our Mexican subsidiary.
(2) Comparable store sales include the sales of U.S. RadioShack company-operated stores and kiosks with more
than 12 full months of recorded sales. Following the termination of the Sprint-branded kiosk business, these
former Sprint-branded kiosks were transformed into multiple wireless carrier RadioShack-branded locations. We
managed and reported 111 of these locations as extensions of existing RadioShack company-operated stores
located in the same shopping malls at December 31, 2009; current year results of such kiosks are included with
these RadioShack company-operated stores for purposes of comparable store sales. For more information
regarding the transition of the Sprint-branded kiosks to RadioShack-branded locations, see Item 1 – “Business”
in this Annual Report on Form 10-K.
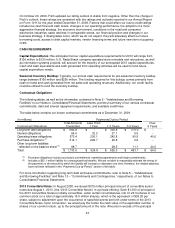
The following table provides a summary of our consolidated net sales and operating revenues by platform
and as a percent of net sales and operating revenues. These consolidated platform sales include sales
from our U.S. RadioShack company-operated stores and kiosks, as well as other sales.
Consolidated Net Sales and Operating Revenues
Year Ended December 31,
(In millions) 2009 2008 2007
Wireless $ 1,633.3 38.2% $ 1,387.3 32.8% $ 1,415.8 33.3%
Accessory 1,058.6 24.8 1,174.6 27.8 1,019.2 24.0
Modern home 561.0 13.1 531.8 12.6 557.1 13.1
Personal electronics 454.9 10.6 549.2 13.0 657.2 15.5
Power 227.6 5.3 244.9 5.8 251.7 5.9
Technical 181.1 4.2 184.6 4.4 185.5 4.4
Service 115.3 2.7 95.5 2.3 100.3 2.3
Other sales (1) 44.2 1.1 56.6 1.3 64.9 1.5
Consolidated net sales and
operating revenues
$ 4,276.0
100.0%
$ 4,224.5
100.0%
$ 4,251.7
100.0%
(1) Other sales include outside sales from repair services and outside sales of our global sourcing operations and
domestic and overseas manufacturing facilities.