Porsche 2008 Annual Report Download - page 205
Download and view the complete annual report
Please find page 205 of the 2008 Porsche annual report below. You can navigate through the pages in the report by either clicking on the pages listed below, or by using the keyword search tool below to find specific information within the annual report.-
 1
1 -
2
-
3
-
4
-
5
-
6
-
7
-
8
-
9
-
10
-
11
-
12
-
13
-
14
-
15
-
16
-
17
-
18
-
19
-
20
-
21
-
22
-
23
-
24
-
25
-
26
-
27
-
28
-
29
-
30
-
31
-
32
-
33
-
34
-
35
-
36
-
37
-
38
-
39
-
40
-
41
-
42
-
43
-
44
-
45
-
46
-
47
-
48
-
49
-
50
-
51
-
52
-
53
-
54
-
55
-
56
-
57
-
58
-
59
-
60
-
61
-
62
-
63
-
64
-
65
-
66
-
67
-
68
-
69
-
70
-
71
-
72
-
73
-
74
-
75
-
76
-
77
-
78
-
79
-
80
-
81
-
82
-
83
-
84
-
85
-
86
-
87
-
88
-
89
-
90
-
91
-
92
-
93
-
94
-
95
-
96
-
97
-
98
-
99
-
100
-
101
-
102
-
103
-
104
-
105
-
106
-
107
-
108
-
109
-
110
-
111
-
112
-
113
-
114
-
115
-
116
-
117
-
118
-
119
-
120
-
121
-
122
-
123
-
124
-
125
-
126
-
127
-
128
-
129
-
130
-
131
-
132
-
133
-
134
-
135
-
136
-
137
-
138
-
139
-
140
-
141
-
142
-
143
-
144
-
145
-
146
-
147
-
148
-
149
-
150
-
151
-
152
-
153
-
154
-
155
-
156
-
157
-
158
-
159
-
160
-
161
-
162
-
163
-
164
-
165
-
166
-
167
-
168
-
169
-
170
-
171
-
172
-
173
-
174
-
175
-
176
-
177
-
178
-
179
-
180
-
181
-
182
-
183
-
184
-
185
-
186
-
187
-
188
-
189
-
190
-
191
-
192
-
193
-
194
-
 195
195 -
 196
196 -
 197
197 -
 198
198 -
 199
199 -
 200
200 -
 201
201 -
 202
202 -
 203
203 -
 204
204 -
 205
205 -
 206
206 -
 207
207 -
 208
208 -
 209
209 -
 210
210 -
 211
211 -
 212
212 -
 213
213 -
 214
214 -
 215
215 -
216
-
217
-
218
-
219
-
220
-
221
-
222
-
223
-
224
-
225
-
226
-
227
-
228
-
229
-
230
-
231
-
232
-
233
-
234
-
235
-
236
-
237
-
238
-
239
-
240
-
241
-
242
-
243
-
244
-
245
-
246
-
247
-
248
-
249
-
250
-
251
-
252
-
253
-
254
 |
 |

203
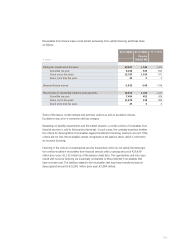
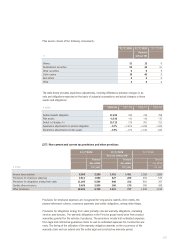
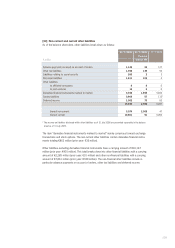
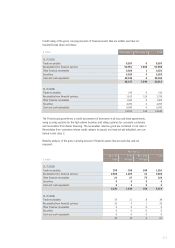
Amounts posted to profit or loss break down as follows:
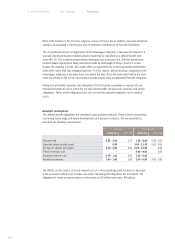
The rate for the expected long-term return on plan assets is based on the long-term returns actu-
ally generated for the portfolio, historical overall market returns and a forecast of expected returns
on the securities classes held in the portfolio. The forecasts are based on the expected rate of
return for comparable pension funds taking the remaining service period as the investment horizon
and using the experience of managers of large portfolios and of experts from the investment
industry. The weighted average return of each class of asset supports the rate of return of the
group anticipated in the long-term.
The actual return on plan assets in the fiscal year amounted to €88 million (prior year: €1 million).
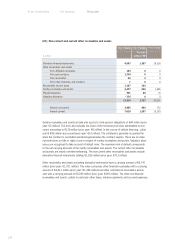
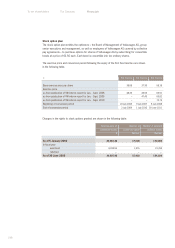
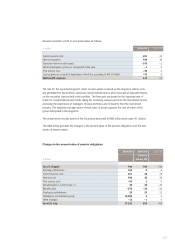
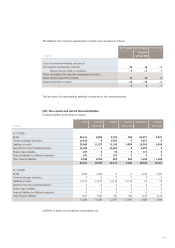
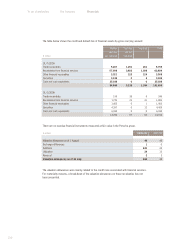
The table below presents the changes in the present value of the pension obligations and the plan
assets at market values.
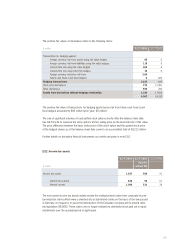
Changes in the present value of pension obligations
€ million 2008/09 2007/08
Current service cost 201 25
Interest expenses 500 38
Expected return on plan assets – 103 – 2
Net actuarial gain (–)/loss (+) recognized in the year – 10
Past service cost – 50 0
Losses/gains as a result of application of limit the according to IAS 19.58(b) – 30 0
Net benefit expense 517 61
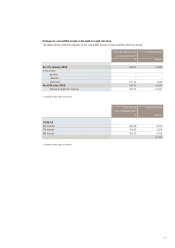
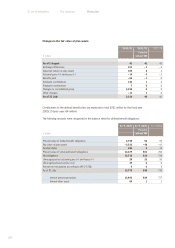
2008/09 2008/09 2007/08
€ million
Porsche
without VW
As of 1 August 760 760 744
Exchange differences 166 0– 6
Current service cost 201 28 25
Interest cost 500 42 38
Past service cost – 50 10
Actuarial gains (–) and losses (+) 26 26 – 43
Benefits paid – 378 – 23 – 20
Employee contributions 26 20 22
Changes to consolidated group 15,983 00
Other changes – 12 – 10
As of 31 July 17,222 853 760