Pizza Hut 2004 Annual Report Download - page 50
Download and view the complete annual report
Please find page 50 of the 2004 Pizza Hut annual report below. You can navigate through the pages in the report by either clicking on the pages listed below, or by using the keyword search tool below to find specific information within the annual report.-
 1
1 -
2
-
3
-
4
-
5
-
6
-
7
-
8
-
9
-
10
-
11
-
12
-
13
-
14
-
15
-
16
-
17
-
18
-
19
-
20
-
21
-
22
-
23
-
24
-
25
-
26
-
27
-
28
-
29
-
30
-
31
-
32
-
33
-
34
-
35
-
36
-
37
-
38
-
39
-
 40
40 -
 41
41 -
 42
42 -
 43
43 -
 44
44 -
 45
45 -
 46
46 -
 47
47 -
 48
48 -
 49
49 -
 50
50 -
 51
51 -
 52
52 -
 53
53 -
 54
54 -
 55
55 -
 56
56 -
 57
57 -
 58
58 -
 59
59 -
 60
60 -
61
-
62
-
63
-
64
-
65
-
66
-
67
-
68
-
69
-
70
-
71
-
72
-
73
-
74
-
75
-
76
-
77
-
78
-
79
-
80
-
81
-
82
-
83
-
84
-
85
 |
 |

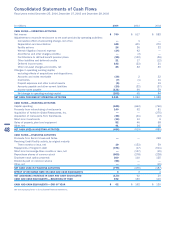
ConsolidatedStatementsofCashFlows
FiscalyearsendedDecember25,2004,December27,2003andDecember28,2002
(inmillions) 2004 2003 2002
CASHFLOWS—OPERATINGACTIVITIES
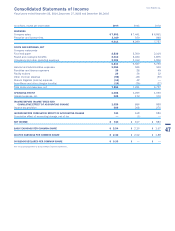
Netincome $ 740 $ 617 $ 583
Adjustmentstoreconcilenetincometonetcashprovidedbyoperatingactivities:
Cumulativeeffectofaccountingchange,netoftax — 1 —
Depreciationandamortization 448 401 370
Facilityactions 26 36 32
Wrenchlitigation(income)expense (14) 42 —
AmeriServeandothercharges(credits) — (3) —
Contributionstodefinedbenefitpensionplans (55) (132) (26)
Otherliabilitiesanddeferredcredits 21 17 (12)
Deferredincometaxes 142 (23) 21
Othernon-cashchargesandcredits,net 25 32 36
Changesinoperatingworkingcapital,
excludingeffectsofacquisitionsanddispositions:
Accountsandnotesreceivable (39) 2 32
Inventories (7) (1) 11
Prepaidexpensesandothercurrentassets (5) — 19
Accountspayableandothercurrentliabilities (20) (32) (37)
Incometaxespayable (131) 96 59
Netchangeinoperatingworkingcapital (202) 65 84
NETCASHPROVIDEDBYOPERATINGACTIVITIES1,131 1,053 1,088
CASHFLOWS—INVESTINGACTIVITIES
Capitalspending (645) (663) (760)
Proceedsfromrefranchisingofrestaurants 140 92 81
AcquisitionofYorkshireGlobalRestaurants,Inc. — — (275)
Acquisitionofrestaurantsfromfranchisees (38) (41) (13)
Short-terminvestments (36) 13 9
Salesofproperty,plantandequipment 52 46 58
Other,net 41 34 15
NETCASHUSEDININVESTINGACTIVITIES (486) (519) (885)
CASHFLOWS—FINANCINGACTIVITIES
ProceedsfromSeniorUnsecuredNotes — — 398
RevolvingCreditFacilityactivity,byoriginalmaturity
Threemonthsorless,net 19 (153) 59
Repaymentsoflong-termdebt (371) (17) (511)
Short-termborrowings-threemonthsorless,net — (137) (15)
Repurchasesharesofcommonstock (569) (278) (228)
Employeestockoptionproceeds 200 110 125
Dividendspaidoncommonshares (58) — —
Other,net — — (15)
NETCASHUSEDINFINANCINGACTIVITIES (779) (475) (187)
EFFECTOFEXCHANGERATEONCASHANDCASHEQUIVALENTS 4 3 4
NET(DECREASE)INCREASEINCASHANDCASHEQUIVALENTS (130) 62 20
CASHANDCASHEQUIVALENTS—BEGINNINGOFYEAR 192 130 110
CASHANDCASHEQUIVALENTS—ENDOFYEAR$ 62 $ 192 $ 130
SeeaccompanyingNotestoConsolidatedFinancialStatements.
48