Pizza Hut 2004 Annual Report Download - page 39
Download and view the complete annual report
Please find page 39 of the 2004 Pizza Hut annual report below. You can navigate through the pages in the report by either clicking on the pages listed below, or by using the keyword search tool below to find specific information within the annual report.-
 1
1 -
2
-
3
-
4
-
5
-
6
-
7
-
8
-
9
-
10
-
11
-
12
-
13
-
14
-
15
-
16
-
17
-
18
-
19
-
20
-
21
-
22
-
23
-
24
-
25
-
26
-
27
-
28
-
 29
29 -
 30
30 -
 31
31 -
 32
32 -
 33
33 -
 34
34 -
 35
35 -
 36
36 -
 37
37 -
 38
38 -
 39
39 -
 40
40 -
 41
41 -
 42
42 -
 43
43 -
 44
44 -
 45
45 -
 46
46 -
 47
47 -
 48
48 -
 49
49 -
50
-
51
-
52
-
53
-
54
-
55
-
56
-
57
-
58
-
59
-
60
-
61
-
62
-
63
-
64
-
65
-
66
-
67
-
68
-
69
-
70
-
71
-
72
-
73
-
74
-
75
-
76
-
77
-
78
-
79
-
80
-
81
-
82
-
83
-
84
-
85
 |
 |

In 2004, the increase in Worldwide Company sales was
drivenbynewunitdevelopment,acquisitionsoffranchisee
restaurants(primarilycertainunitsinCanadawhichwenow
operate),and same storesales growth,partiallyoffsetby
refranchising and store closures. Excluding the favorable
impactofbothforeigncurrencytranslationandtheYGRacqui-
sition,WorldwideCompanysalesincreased4%in2003.The
increasewasdrivenbynewunitdevelopment,partiallyoffset
bystoreclosuresandrefranchising.
In2004,theincreaseinWorldwidefranchiseandlicense
feeswasdrivenbynewunitdevelopment,samestoresales
growth,andrefranchising,partiallyoffsetbystoreclosures
andacquisitionsoffranchiseerestaurants(primarilycertain
unitsinCanadawhichwenowoperate).Excludingthefavor-
ableimpactofbothforeigncurrencytranslationandtheYGR
acquisition,Worldwidefranchiseandlicensefeesincreased
5%in2003.Theincreasewasdrivenbynewunitdevelop-
ment,royaltyrateincreasesandsamestoresalesgrowth,
partiallyoffsetbystoreclosures.
In2004,theincreaseinU.S.Companysaleswasdriven
by new unit development and same store sales growth,
partiallyoffsetbyrefranchisingandstoreclosures.Excluding
thefavorableimpactoftheYGRacquisition,U.S.Company
sales increased 2% in 2003. The increase was driven by
newunitdevelopment,partiallyoffsetbystoreclosuresand
refranchising.
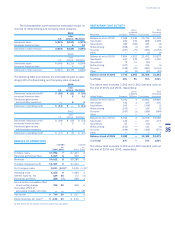
U.SsamestoresalesincludesonlyCompanyrestaurants
thathavebeenopenoneyearormore.U.S.blendedsame
storesalesincludeKFC,PizzaHutandTacoBellCompany-
ownedrestaurantsonly.U.S.samestoresalesforLongJohn
Silver’sandA&Wrestaurantsarenotincluded.Followingare
thesamestoresalesgrowthresultsbybrand:
Same Average
Store Guest
2004 Sales Transactions Check
KFC (2)% (4)% 2%
PizzaHut 5% 2% 3%
TacoBell 5% 3% 2%
Same Average
Store Guest
2003 Sales Transactions Check
KFC (2)% (4)% 2%
PizzaHut (1)% (4)% 3%
TacoBell 2% 1% 1%
In2004,blendedCompanysamestoresalesincreased3%
duetoincreasesinaverageguestcheckandtransactions.In
2003,blendedCompanysamestoresaleswereflatdueto
adecreaseintransactionsoffsetbyanincreaseinaverage
guestcheck.
In2004,theincreaseinU.S.franchiseandlicensefees
wasdrivenbysamestoresalesgrowth,newunitdevelop-
mentandrefranchising,partially offset bystoreclosures.
ExcludingthefavorableimpactoftheYGRacquisition,U.S.
franchiseandlicensefeesremainedessentiallyflatin2003
asadecreaseprimarilydrivenbystoreclosureswaslargely
offsetbynewunitdevelopment.
In2004,theincreaseinInternationalCompanysaleswas
drivenbynewunitdevelopment,acquisitionsoffranchisee
restaurants(primarilycertainunitsinCanadawhichwenow
operate),and same storesales growth,partiallyoffsetby
refranchisingandstoreclosures.In2003,theincreasein
InternationalCompanysaleswasdrivenbynewunitdevel-
opment,partiallyoffsetbyrefranchising,samestoresales
declinesandstoreclosures.
In 2004, the increase in International franchise and
license fees was driven by new unit development, same
storesalesgrowthandrefranchising,partiallyoffsetbystore
closures and our acquisitions of franchisee restaurants
(primarilycertainunitsinCanadawhichwenowoperate).In
2003,theincreaseinInternationalfranchiseandlicensefees
wasdrivenbynewunitdevelopment,royaltyrateincreasesand
samestoresalesgrowth,partiallyoffsetbystoreclosures.
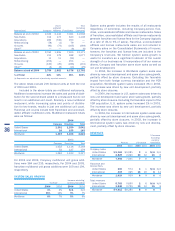
COMPANYRESTAURANTMARGINS
2004UnitedStates International Worldwide
Companysales 100.0% 100.0% 100.0%
Foodandpaper 29.9 35.1 31.8
Payrollandemployeebenefits 30.5 19.1 26.4
Occupancyandother
operatingexpenses 25.8 30.0 27.3
Companyrestaurantmargin 13.8% 15.8% 14.5%
2003 UnitedStates International Worldwide
Companysales 100.0% 100.0% 100.0%
Foodandpaper 28.8 35.5 30.9
Payrollandemployeebenefits 31.0 19.0 27.2
Occupancyandother
operatingexpenses 25.6 30.0 27.1
Companyrestaurantmargin 14.6% 15.5% 14.8%
2002 UnitedStates International Worldwide
Companysales 100.0% 100.0% 100.0%
Foodandpaper 28.2 36.1 30.6
Payrollandemployeebenefits 30.9 18.7 27.2
Occupancyandother
operatingexpenses 24.9 29.2 26.2
Companyrestaurantmargin 16.0% 16.0% 16.0%
In 2004, the decrease in U.S. restaurant margins as a
percentageofsaleswasdrivenbyhigherfoodand paper
costsandhigheroccupancyandothercosts,partiallyoffset
bytheimpactofsamestoresalesincreasesonrestaurant
margin.Higherfoodandpapercostswereprimarilydrivenby
increasedcommoditycosts(principallycheeseandmeats)
andhigheroccupancyandothercostswereprimarilydriven
byincreasedexpenseresultingfromtheadjustmentrelated
toouraccountingforleasesandthedepreciationofleasehold
37
Yum!Brands,Inc.