Pizza Hut 2004 Annual Report Download - page 38
Download and view the complete annual report
Please find page 38 of the 2004 Pizza Hut annual report below. You can navigate through the pages in the report by either clicking on the pages listed below, or by using the keyword search tool below to find specific information within the annual report.-
 1
1 -
2
-
3
-
4
-
5
-
6
-
7
-
8
-
9
-
10
-
11
-
12
-
13
-
14
-
15
-
16
-
17
-
18
-
19
-
20
-
21
-
22
-
23
-
24
-
25
-
26
-
27
-
 28
28 -
 29
29 -
 30
30 -
 31
31 -
 32
32 -
 33
33 -
 34
34 -
 35
35 -
 36
36 -
 37
37 -
 38
38 -
 39
39 -
 40
40 -
 41
41 -
 42
42 -
 43
43 -
 44
44 -
 45
45 -
 46
46 -
 47
47 -
 48
48 -
49
-
50
-
51
-
52
-
53
-
54
-
55
-
56
-
57
-
58
-
59
-
60
-
61
-
62
-
63
-
64
-
65
-
66
-
67
-
68
-
69
-
70
-
71
-
72
-
73
-
74
-
75
-
76
-
77
-
78
-
79
-
80
-
81
-
82
-
83
-
84
-
85
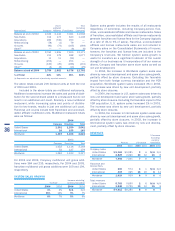
 |
 |

Uncon- Total
solidated Excluding
International Company Affiliates Franchisees Licensees
Balanceatendof2002 2,333 2,144 7,061 11,538
NewBuilds 312 173 623 1,108
Acquisitions 283 (736) 453 —
Refranchising (78) (1) 79 —
Closures (90) (74) (305) (469)
Other(a) — — (6) (6)
Balanceatendof2003 2,760 1,506 7,905 12,171
NewBuilds 311 178 588 1,077
Acquisitions 11 11 (22) —
Refranchising (204) — 204 —
Closures (120) (25) (286) (431)
Other(a) (4) (8) (13) (25)
Balanceatendof2004 2,754 1,662 8,376 12,792
%ofTotal 22% 13% 65% 100%
(a)Representsanadjustmentofpreviouslyreportedamounts.
Theabovetotalsexclude206licensedunitsatboththeend
of2004and2003.
Includedintheabovetotalsaremultibrandrestaurants.
Multibrandconversionsincreasethesalesandpointsofdistri-
butionforthesecondbrandaddedtoarestaurantbutdonot
resultinanadditionalunitcount.Similarly,anewmultibrand
restaurant, while increasing sales and points of distribu-
tionfortwobrands,resultsinjustoneadditionalunitcount.
Franchiseunitcountsincludebothfranchiseeandunconsoli-
datedaffiliatemultibrandunits.Multibrandrestauranttotals
wereasfollows:
2004
Company Franchise Total
UnitedStates 1,391 1,250 2,641
International 28 155 183
Worldwide 1,419 1,405 2,824
2003
Company Franchise Total
UnitedStates 1,032 1,116 2,148
International 52 127 179
Worldwide 1,084 1,243 2,327
For2004and 2003,Companymultibrand unitgross addi-
tionswere384and235,respectively.For2004and2003,
franchisemultibrandunitgrossadditionswere169and194,
respectively.
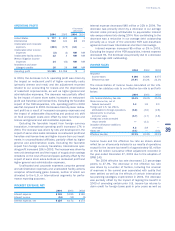
SYSTEMSALESGROWTH
Increaseexcluding
Increase currencytranslation
2004 2003 2004 2003
UnitedStates 3% 3% N/A N/A
International 15% 14% 9% 7%
Worldwide 8% 7% 5% 5%
Systemsalesgrowthincludestheresultsofallrestaurants
regardless of ownership, including Company-owned, fran-
chise,unconsolidatedaffiliateandlicenserestaurants.Sales
offranchise,unconsolidatedaffiliateandlicenserestaurants
generatefranchiseandlicensefeesfortheCompany(typically
atarateof4%to6%ofsales).Franchise,unconsolidated
affiliateandlicenserestaurantssalesarenotincludedin
CompanysalesontheConsolidatedStatementsofIncome;
however,thefranchiseandlicensefeesareincludedinthe
Company’s revenues. We believe system sales growth is
usefultoinvestorsasasignificantindicatoroftheoverall
strengthofourbusinessasitincorporatesallofourrevenue
drivers,Companyandfranchisesamestoresalesaswellas
netunitdevelopment.
In2004,theincreaseinWorldwidesystemsaleswas
drivenbynewunitdevelopmentandsamestoresalesgrowth,
partially offset by store closures. Excluding the favorable
impactfrombothforeigncurrencytranslationandtheYGR
acquisition,Worldwidesystemsalesincreased3%in2003.
Theincreasewasdrivenbynewunitdevelopment,partially
offsetbystoreclosures.
In2004,theincreaseinU.S.systemsaleswasdrivenby
newunitdevelopmentandsamestoresalesgrowth,partially
offsetbystoreclosures.Excludingthefavorableimpactofthe
YGRacquisition,U.S.systemsalesincreased1%in2003.
Theincreasewasdrivenbynewunitdevelopment,partially
offsetbystoreclosures.
In2004,theincreaseinInternationalsystemsaleswas
drivenbynewunitdevelopmentandsamestoresalesgrowth,
partiallyoffsetbystoreclosures.In2003,theincreasein
Internationalsystemsaleswasdrivenbynewunitdevelop-
ment,partiallyoffsetbystoreclosures.
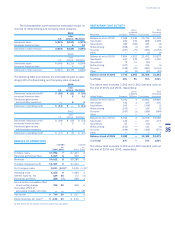
REVENUES
%Increase
excluding
currency
Amount %Increase translation
2004 2003 2004 2003 2004 2003
Companysales
UnitedStates $5,163 $5,081 2 6 N/A N/A
International 2,829 2,360 20 12 16 8
Worldwide 7,992 7,441 7 8 6 7
Franchiseand
licensefees
UnitedStates 600 574 4 1 N/A N/A
International 419 365 15 23 8 14
Worldwide 1,019 939 8 9 6 6
Totalrevenues
UnitedStates 5,763 5,655 2 6 N/A N/A
International 3,248 2,725 19 13 15 8
Worldwide $9,011 $8,380 8 8 6 7
36