Pizza Hut 2004 Annual Report Download - page 42
Download and view the complete annual report
Please find page 42 of the 2004 Pizza Hut annual report below. You can navigate through the pages in the report by either clicking on the pages listed below, or by using the keyword search tool below to find specific information within the annual report.-
 1
1 -
2
-
3
-
4
-
5
-
6
-
7
-
8
-
9
-
10
-
11
-
12
-
13
-
14
-
15
-
16
-
17
-
18
-
19
-
20
-
21
-
22
-
23
-
24
-
25
-
26
-
27
-
28
-
29
-
30
-
31
-
 32
32 -
 33
33 -
 34
34 -
 35
35 -
 36
36 -
 37
37 -
 38
38 -
 39
39 -
 40
40 -
 41
41 -
 42
42 -
 43
43 -
 44
44 -
 45
45 -
 46
46 -
 47
47 -
 48
48 -
 49
49 -
 50
50 -
 51
51 -
 52
52 -
53
-
54
-
55
-
56
-
57
-
58
-
59
-
60
-
61
-
62
-
63
-
64
-
65
-
66
-
67
-
68
-
69
-
70
-
71
-
72
-
73
-
74
-
75
-
76
-
77
-
78
-
79
-
80
-
81
-
82
-
83
-
84
-
85
 |
 |

therecognitionin2004ofvaluationallowancesforcertain
deferredtaxassetswhoserealizationisnolongerconsidered
morelikelythannot.
The2003effectivetaxratedecreased1.9percentage
pointsto30.2%.Thedecreaseintheeffectivetaxratewas
primarilyduetoa4.1percentagepointbenefitofamending
certainpriorU.S.incometaxreturnstoclaimcreditforforeign
taxespaidinprioryears.Thereturnswereamendedupon
ourdeterminationthatitwasmorebeneficialtoclaimcredit
forsuchtaxesthantodeductsuchtaxes,ashadbeendone
whenthereturnswereoriginallyfiled.Infutureyears,weantic-
ipatecontinuingtoclaimcreditforforeigntaxespaidinthe
thencurrentyear,aswehavedonein2004,2003and2002.
However,theamendedreturnbenefitrecognizedin2003was
non-recurring.Thedecreaseinthe2003effectivetaxrate
waspartiallyoffsetbytherecognitionofvaluationallowances
forcertaindeferredtaxassetswhoserealizationisnolonger
consideredmorelikelythannot.SeeNote22foradiscussion
ofvaluationallowances.
Adjustments to reserves and prior years include the
effectsofthereconciliationofincometaxamountsrecorded
in our Consolidated Statements of Income to amounts
reflectedonourtaxreturns,includinganyadjustmentstothe
ConsolidatedBalanceSheets.Adjustmentstoreservesand
prioryearsalsoincludeschangesintaxreservesestablished
forpotentialexposurewemayincurifataxingauthoritytakes
apositiononamattercontrarytoourposition.Weevaluate
thesereserves,including interest thereon,onaquarterly
basistoinsurethattheyhavebeenappropriatelyadjusted
forevents,includingauditsettlements,thatwebelievemay
impactourexposure.
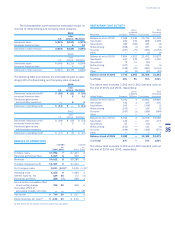
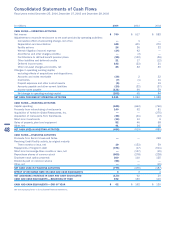
CONSOLIDATEDCASHFLOWS
Netcashprovidedbyoperatingactivitieswas$1,131million
compared to $1,053million in 2003. The increase was
primarilydrivenbyanincreaseinnetincomeandadecrease
intheamountofvoluntarycontributionstoourfundedpension
plancomparedto2003,partiallyoffsetbyhigherincometax
paymentsin2004.
In2003,netcashprovidedbyoperatingactivitieswas
$1,053million compared to $1,088million in 2002. The
decreasewasprimarilydrivenby$130millioninvoluntary
contributionstoourfundedpensionplanin2003,partially
offsetbyhighernetincome.
Netcashusedininvestingactivitieswas$486million
versus$519million in 2003.Thedecrease wasprimarily
drivenbyhigherproceedsfromrefranchisingofrestaurants
andlowercapitalspendingcomparedto2003,partiallyoffset
bytheimpactofthetimingofpurchasesandsalesofshort-
terminvestments.
In 2003, net cash used in investing activities was
$519millionversus$885millionin2002.Thedecreasein
cashusedwasprimarilydrivenbythe$275millionacquisi-
tionofYGRin2002andlowercapitalspendingin2003.
Netcashusedinfinancingactivitieswas$779million
versus $475million in 2003. The increase in 2004 was
primarilydrivenbyhighersharerepurchases,highernetdebt
repaymentsandthepaymentoftwoquarterlydividends,partially
offsetbyhigherproceedsfromstockoptionexercises.
In 2003, net cash used in financing activities was
$475million versus $187million in 2002. The increase
wasprimarilydrivenbyhighernetdebtrepaymentsandhigher
sharesrepurchasedin2003.
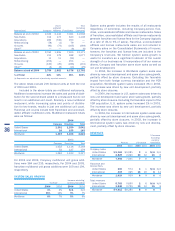
CONSOLIDATEDFINANCIALCONDITION
Assetsincreased$76millionor1%to$5.7billionprimarily
duetoanincreaseinproperty,plantandequipmentdrivenby
capitalexpendituresinexcessofdepreciation.Theincrease
wasalsopartiallydrivenbytheexistenceofafederalincome
tax receivable at December25,2004 recordedinprepaid
expensesandothercurrentassetsandthetimingofthecollec-
tionofcertainaccountsreceivable.Theincreasewaspartially
offsetbytheimpactofhigherspendingforfinancingactivities
comparedto2003,asdescribedabove,andadecreasein
otherassetsasaresultoftheutilizationofdeferredincome
taxassetsin2004.
Liabilitiesdecreased$399millionor9%to$4.1billion
primarily due to lower long-term debt as a result of the
early redemptionof our 2005 Senior Unsecured Notes of
$350millionin2004andlowerincometaxespayabledue
totheexcessofcurrentyeartaxpaymentsmadeoverthe
currentyearprovision.
LIQUIDITYANDCAPITALRESOURCES
OperatingintheQSRindustryallowsustogeneratesubstan-
tialcashflowsfromtheoperationsofourcompanystores
andfromourfranchiseoperations,whichrequirealimited
YUMinvestment.Ineachofthelastthreefiscalyears,net
cashprovidedbyoperatingactivitieshasexceeded$1billion.
Thesecashflowshaveallowedustofundourdiscretionary
spending, while at the same time reducing our long-term
debtbalances.Weexpecttheselevelsofnetcashprovided
byoperatingactivitiestocontinueintheforeseeablefuture.
Ourdiscretionaryspendingincludescapitalspendingfornew
restaurants,acquisitions of restaurants fromfranchisees,
repurchasesofsharesofourcommonstockanddividends
paidtoourshareholders.Thoughadeclineinrevenuescould
adverselyimpactourcashflowsfromoperations,webelieve
ouroperatingcashflows,ourabilitytoreducediscretionary
spending,andourborrowingcapacitywillallowustomeetour
cashrequirementsin2005andbeyond.
We initiated the payment of quarterly dividends in
2004withtwoquarterlydividendspaidtotaling$58million.
Additionally,onNovember12,2004ourBoardofDirectors
approveda cash dividend of $0.10 pershareofcommon
stocktobedistributedonFebruary4,2005toshareholders
ofrecordatthecloseofbusinessonJanuary14,2005.On
40