Panera Bread 2011 Annual Report Download - page 80
Download and view the complete annual report
Please find page 80 of the 2011 Panera Bread annual report below. You can navigate through the pages in the report by either clicking on the pages listed below, or by using the keyword search tool below to find specific information within the annual report.-
 1
1 -
2
-
3
-
4
-
5
-
6
-
7
-
8
-
9
-
10
-
11
-
12
-
13
-
14
-
15
-
16
-
17
-
18
-
19
-
20
-
21
-
22
-
23
-
24
-
25
-
26
-
27
-
28
-
29
-
30
-
31
-
32
-
33
-
34
-
35
-
36
-
37
-
38
-
39
-
40
-
41
-
42
-
43
-
44
-
45
-
46
-
47
-
48
-
49
-
50
-
51
-
52
-
53
-
54
-
55
-
56
-
57
-
58
-
59
-
60
-
61
-
62
-
63
-
64
-
65
-
66
-
67
-
68
-
69
-
 70
70 -
 71
71 -
 72
72 -
 73
73 -
 74
74 -
 75
75 -
 76
76 -
 77
77 -
 78
78 -
 79
79 -
 80
80 -
 81
81 -
 82
82 -
 83
83 -
 84
84 -
 85
85 -
 86
86 -
 87
87 -
 88
88 -
 89
89 -
 90
90 -
91
-
92
-
93
-
94
-
95
-
96
 |
 |

72
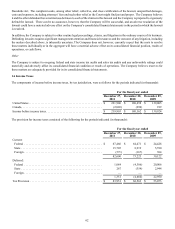
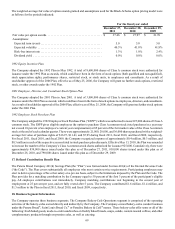
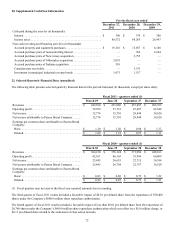
20. Supplemental Cash Flow Information
Cash paid during the year for (in thousands):
Interest . . . . . . . . . . . . . . . . . . . . . . . . . . . . . . . . . . . . . . . . . . . . . . . . . . . . .
Income taxes . . . . . . . . . . . . . . . . . . . . . . . . . . . . . . . . . . . . . . . . . . . . . . . .
Non-cash investing and financing activities (in thousands):
Accrued property and equipment purchases . . . . . . . . . . . . . . . . . . . . . . . .
Accrued purchase price of noncontrolling interest . . . . . . . . . . . . . . . . . . .
Accrued purchase price of New Jersey acquisition. . . . . . . . . . . . . . . . . . .
Accrued purchase price of Milwaukee acquisition . . . . . . . . . . . . . . . . . . .
Accrued purchase price of Indiana acquisition . . . . . . . . . . . . . . . . . . . . . .
Canadian note receivable. . . . . . . . . . . . . . . . . . . . . . . . . . . . . . . . . . . . . . .
Investment in municipal industrial revenue bonds . . . . . . . . . . . . . . . . . . .
For the fiscal year ended
December 27,
2011
$ 390
80,572
$ 19,116
—
—
2,055
510
—
1,673
December 28,
2010
$ 379
68,263
$ 13,057
764
2,755
—
—
3,333
1,517
December 29,
2009
$ 380
26,947
$ 6,108
2,264
—
—
—
—
—
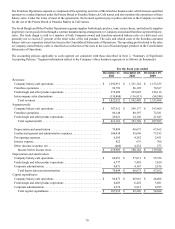
21. Selected Quarterly Financial Data (unaudited)
The following table presents selected quarterly financial data for the periods indicated (in thousands, except per share data):
Revenues . . . . . . . . . . . . . . . . . . . . . . . . . . . . . . . . . . . . . . .
Operating profit . . . . . . . . . . . . . . . . . . . . . . . . . . . . . . . . . .
Net income. . . . . . . . . . . . . . . . . . . . . . . . . . . . . . . . . . . . . .
Net income attributable to Panera Bread Company . . . . . .
Earnings per common share attributable to Panera Bread
Company:
Basic . . . . . . . . . . . . . . . . . . . . . . . . . . . . . . . . . . . . . . . . .
Diluted. . . . . . . . . . . . . . . . . . . . . . . . . . . . . . . . . . . . . . . .
Fiscal 2011 - quarters ended (1)
March 29
$ 422,100
52,974
32,774
32,774
$ 1.10
$ 1.09
June 28
$ 451,080
57,132
35,710
35,710
$ 1.20
$ 1.18
September 27
$ 453,087
47,607
28,848
28,848
$ 0.98
$ 0.97
December 27
$ 495,765
62,546
38,620
38,620
$ 1.33
$ 1.31
Revenues . . . . . . . . . . . . . . . . . . . . . . . . . . . . . . . . . . . . . . .
Operating profit . . . . . . . . . . . . . . . . . . . . . . . . . . . . . . . . . .
Net income. . . . . . . . . . . . . . . . . . . . . . . . . . . . . . . . . . . . . .
Net income attributable to Panera Bread Company . . . . . .
Earnings per common share attributable to Panera Bread
Company:
Basic . . . . . . . . . . . . . . . . . . . . . . . . . . . . . . . . . . . . . . . . .
Diluted. . . . . . . . . . . . . . . . . . . . . . . . . . . . . . . . . . . . . . . .
Fiscal 2010 - quarters ended (1)
March 30
$ 364,210
42,161
25,845
25,845
$ 0.83
$ 0.82
June 29
$ 378,124
46,103
26,655
26,704
$ 0.86
$ 0.85
September 28
$ 371,994
35,996
22,715
22,797
$ 0.75
$ 0.75
December 28
$ 428,161
60,809
36,384
36,520
$ 1.22
$ 1.21
(1) Fiscal quarters may not sum to the fiscal year reported amounts due to rounding.
The third quarter of fiscal 2011 results included a favorable impact of $0.01 per diluted share from the repurchase of 850,400
shares under the Company’s $600.0 million share repurchase authorization.
The fourth quarter of fiscal 2011 results included a favorable impact of less than $0.01 per diluted share from the repurchase of
26,700 shares under the Company’s $600.0 million share repurchase authorization which was offset by a $5.0 million charge, or
$0.11 per diluted share related to the settlement of class action lawsuits.