Panera Bread 2011 Annual Report Download - page 29
Download and view the complete annual report
Please find page 29 of the 2011 Panera Bread annual report below. You can navigate through the pages in the report by either clicking on the pages listed below, or by using the keyword search tool below to find specific information within the annual report.-
 1
1 -
2
-
3
-
4
-
5
-
6
-
7
-
8
-
9
-
10
-
11
-
12
-
13
-
14
-
15
-
16
-
17
-
18
-
 19
19 -
 20
20 -
 21
21 -
 22
22 -
 23
23 -
 24
24 -
 25
25 -
 26
26 -
 27
27 -
 28
28 -
 29
29 -
 30
30 -
 31
31 -
 32
32 -
 33
33 -
 34
34 -
 35
35 -
 36
36 -
 37
37 -
 38
38 -
 39
39 -
40
-
41
-
42
-
43
-
44
-
45
-
46
-
47
-
48
-
49
-
50
-
51
-
52
-
53
-
54
-
55
-
56
-
57
-
58
-
59
-
60
-
61
-
62
-
63
-
64
-
65
-
66
-
67
-
68
-
69
-
70
-
71
-
72
-
73
-
74
-
75
-
76
-
77
-
78
-
79
-
80
-
81
-
82
-
83
-
84
-
85
-
86
-
87
-
88
-
89
-
90
-
91
-
92
-
93
-
94
-
95
-
96
 |
 |
21
for the fiscal year ended December 29, 2009, or fiscal 2009, would have been approximately 2.2 percent and 2.0 percent,
respectively. Adjusted to reflect a comparative 53 week period in the fiscal year ended December 25, 2007, or fiscal 2007 (52
weeks in fiscal 2007 plus one week of fiscal 2008), Company-owned and franchise-operated comparable bakery-cafe sales
for fiscal 2008 would have been approximately 3.5 percent and 3.3 percent, respectively. Adjusted on a calendar basis to
match the specific weeks in fiscal 2009 to the same specific weeks in fiscal 2008, Company-owned and franchise-operated
comparable net bakery-cafe sales for fiscal 2009 would have been 2.4 percent and 2.0 percent, respectively. For further
information regarding comparable net bakery-cafe sales and the modification to the method by which we determine bakery-
cafes included in our comparable net bakery-cafe sales, see Item 7. Management’s Discussion and Analysis of Consolidated
Financial Condition and Results of Operations.
ITEM 7. MANAGEMENT’S DISCUSSION AND ANALYSIS OF CONSOLIDATED FINANCIAL CONDITION AND
RESULTS OF OPERATIONS
General
Our revenues are derived from Company-owned net bakery-cafe sales, fresh dough and other product sales to franchisees, and
franchise royalties and fees. Fresh dough and other product sales to franchisees are primarily comprised of sales of fresh dough,
produce, tuna, and cream cheese to certain of our franchisees. The cost of food and paper products, labor, occupancy, and other
operating expenses relate primarily to Company-owned net bakery-cafe sales. The cost of fresh dough and other product sales to
franchisees relates primarily to the sale of fresh dough, produce, tuna, and cream cheese to franchisees. General and administrative,
depreciation and amortization, and pre-opening expenses relate to all areas of revenue generation.
Our fiscal year ends on the last Tuesday in December. Each of our fiscal years ended December 27, 2011, December 28, 2010,
and December 29, 2009, had 52 weeks.
Use of Non-GAAP Measurements
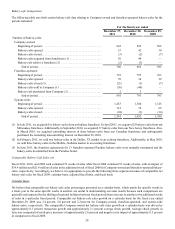
We include in this report information on Company-owned, franchise-operated, and system-wide comparable net bakery-cafe sales
percentages. In fiscal 2010, we modified the method by which we determine bakery-cafes included in our comparable net bakery-
cafe sales percentages to include those bakery-cafes with an open date prior to the first day of our prior fiscal year, which we refer
to as our base store bakery-cafes. Previously, comparable net bakery-cafe sales percentages were based on bakery-cafes that had
been in operation for 18 months. While this methodology modification did not have a material impact on previously reported
amounts, prior periods have been updated to conform to current methodology. Company-owned comparable net bakery-cafe sales
percentages are based on sales from Company-owned bakery-cafes included in our base store bakery-cafes. Franchise-operated
comparable net bakery-cafe sales percentages are based on sales from franchise-operated bakery-cafes, as reported by franchisees,
that are included in our base store bakery-cafes. System-wide comparable net bakery-cafe sales percentages are based on sales at
Company-owned and franchise-operated bakery-cafes that are included in our base store bakery-cafes. Acquired Company-owned
and franchise-operated bakery-cafes and other restaurant or bakery-cafe concepts are included in our comparable net bakery-cafe
sales percentages after we have acquired a 100 percent ownership interest and such acquisition occurred prior to the first day of
our prior fiscal year. Comparable net bakery-cafe sales exclude closed locations.
Comparable net bakery-cafe sales percentages are non-GAAP financial measures, which should not be considered in isolation or
as a substitute for other measures of performance prepared in accordance with generally accepted accounting principles in the
United States, or GAAP, and may not be equivalent to comparable net bakery-cafe sales as defined or used by other companies.
We do not record franchise-operated net bakery-cafe sales as revenues. However, royalty revenues are calculated based on a
percentage of franchise-operated net bakery-cafe sales, as reported by franchisees. We use franchise-operated and system-wide
sales information internally in connection with store development decisions, planning, and budgeting analyses. We believe
franchise-operated and system-wide sales information is useful in assessing consumer acceptance of our brand, facilitates an
understanding of our financial performance and the overall direction and trends of sales and operating income, helps us appreciate
the effectiveness of our advertising and marketing initiatives, to which our franchisees also contribute based on a percentage of
their net sales, and provides information that is relevant for comparison within the industry.
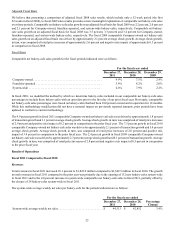
We also include in this report information on Company-owned, franchise-operated, and system-wide average weekly net sales.
Average weekly net sales are calculated by dividing total net sales in the period by operating weeks in the period. Accordingly,
year-over-year results reflect sales for all locations, whereas comparable net bakery-cafe sales exclude closed locations and are
based on sales from bakery-cafes included in our base store bakery-cafes. New stores typically experience an opening “honeymoon”
period during which they generate higher average weekly net sales in the first 12 to 16 weeks they are open as customers “settle-
in” to normal usage patterns from initial trial of the location. On average, the “settle-in” experienced is 5 percent to 10 percent
less than the average weekly net sales during the “honeymoon” period. As a result, year-over-year results of average weekly net
sales are generally lower than the results in comparable net bakery-cafe sales. This results from the relationship of the number of