Panera Bread 2011 Annual Report Download - page 28
Download and view the complete annual report
Please find page 28 of the 2011 Panera Bread annual report below. You can navigate through the pages in the report by either clicking on the pages listed below, or by using the keyword search tool below to find specific information within the annual report.-
 1
1 -
2
-
3
-
4
-
5
-
6
-
7
-
8
-
9
-
10
-
11
-
12
-
13
-
14
-
15
-
16
-
17
-
 18
18 -
 19
19 -
 20
20 -
 21
21 -
 22
22 -
 23
23 -
 24
24 -
 25
25 -
 26
26 -
 27
27 -
 28
28 -
 29
29 -
 30
30 -
 31
31 -
 32
32 -
 33
33 -
 34
34 -
 35
35 -
 36
36 -
 37
37 -
 38
38 -
39
-
40
-
41
-
42
-
43
-
44
-
45
-
46
-
47
-
48
-
49
-
50
-
51
-
52
-
53
-
54
-
55
-
56
-
57
-
58
-
59
-
60
-
61
-
62
-
63
-
64
-
65
-
66
-
67
-
68
-
69
-
70
-
71
-
72
-
73
-
74
-
75
-
76
-
77
-
78
-
79
-
80
-
81
-
82
-
83
-
84
-
85
-
86
-
87
-
88
-
89
-
90
-
91
-
92
-
93
-
94
-
95
-
96
 |
 |

20
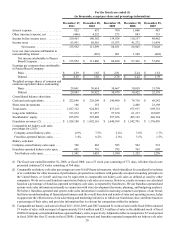
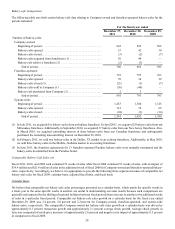
For the fiscal year ended (1)
(in thousands, except per share and percentage information)
December 27,
2011
December 28,
2010
December 29,
2009
December 30,
2008
December 25,
2007
Interest expense . . . . . . . . . . . . . . . . . . . .
Other (income) expense, net . . . . . . . . . .
Income before income taxes . . . . . . . . . .
Income taxes . . . . . . . . . . . . . . . . . . . . . .
Net income. . . . . . . . . . . . . . . . . .
Less: net (loss) income attributable to
noncontrolling interest . . . . . . . . . . . . . . .
Net income attributable to Panera
Bread Company . . . . . . . . . . . . . . . .
Earnings per common share attributable
to Panera Bread Company:
Basic . . . . . . . . . . . . . . . . . . . . . . . . .
Diluted . . . . . . . . . . . . . . . . . . . . . . .
Weighted average shares of common and
common equivalent shares outstanding:
Basic . . . . . . . . . . . . . . . . . . . . . . . . .
Diluted . . . . . . . . . . . . . . . . . . . . . . .
Consolidated balance sheet data:
Cash and cash equivalents . . . . . . . . . . . .
Short-term investments . . . . . . . . . . . . . .
Total assets. . . . . . . . . . . . . . . . . . . . . . . .
Long-term liabilities. . . . . . . . . . . . . . . . .
Stockholders’ equity. . . . . . . . . . . . . . . . .
Franchisee revenues (2) . . . . . . . . . . . . . .
Comparable net bakery-cafe sales
percentage for (2)(3):
Company-owned bakery-cafes . . . . . . .
Franchise-operated bakery-cafes . . . . . .
Bakery-cafe data:
Company-owned bakery-cafes open . . . .
Franchise-operated bakery-cafes open. . .
Total bakery-cafes open. . . . . . . . . . . . .
822
(466)
219,903
83,951
135,952
—
$ 135,952
$ 4.59
$ 4.55
29,601
29,903
$ 222,640
186
1,027,322
133,912
655,076
$ 1,828,188
4.9%
3.4%
740
801
1,541
675
4,232
180,162
68,563
111,599
(267)
$ 111,866
$ 3.65
$ 3.62
30,614
30,922
$ 229,299
152
924,581
117,457
595,608
$ 1,802,116
7.5%
8.2%
662
791
1,453
700
273
139,924
53,073
86,851
801
$ 86,050
$ 2.81
$ 2.78
30,667
30,979
$ 246,400
—
837,165
97,870
597,036
$ 1,640,309
2.4%
2.0%
585
795
1,380
1,606
883
110,217
41,272
68,945
1,509
$ 67,436
2.24
$ 2.22
30,059
30,422
$ 74,710
2,400
673,917
61,217
495,162
$ 1,542,791
3.8%
3.5%
562
763
1,325
483
333
88,462
31,434
57,028
(428)
$ 57,456
$ 1.81
$ 1.79
31,708
32,178
$ 68,242
23,198
698,752
122,807
446,164
$ 1,376,430
1.7%
1.5%
532
698
1,230
(1) The fiscal year ended December 30, 2008, or fiscal 2008, was a 53 week year consisting of 371 days. All other fiscal years
presented contained 52 weeks consisting of 364 days.
(2) Comparable net bakery-cafe sales percentages are non-GAAP financial measures, which should not be considered in isolation
or as a substitute for other measures of performance prepared in accordance with generally accepted accounting principles in
the United States, or GAAP, and may not be equivalent to comparable net bakery-cafe sales as defined or used by other
companies. We do not record franchise-operated net bakery-cafe sales as revenues. However, royalty revenues are calculated
based on a percentage of franchise-operated net bakery-cafe sales, as reported by franchisees. We use franchise-operated and
system-wide sales information internally in connection with store development decisions, planning, and budgeting analyses.
We believe franchise-operated and system-wide sales information is useful in assessing consumer acceptance of our brand,
facilitates an understanding of financial performance and the overall direction and trends of sales and operating income, helps
us appreciate the effectiveness of our advertising and marketing initiatives to which our franchisees also contribute based on
a percentage of their sales, and provides information that is relevant for comparison within the industry.
(3) Comparable net bakery-cafe sales for fiscal 2011, 2010, 2009, and 2007 contained 52 weeks of sales while fiscal 2008 contained
53 weeks of sales, with an impact of approximately $14.4 million and $21.4 million of sales in the additional week of fiscal
2008 for Company-owned and franchise-operated bakery-cafes, respectively. Adjusted to reflect a comparative 52 week period
in fiscal 2008 (the first 52 weeks in fiscal 2008), Company-owned and franchise-operated comparable net bakery-cafe sales