Panera Bread 2011 Annual Report Download - page 50
Download and view the complete annual report
Please find page 50 of the 2011 Panera Bread annual report below. You can navigate through the pages in the report by either clicking on the pages listed below, or by using the keyword search tool below to find specific information within the annual report.-
 1
1 -
2
-
3
-
4
-
5
-
6
-
7
-
8
-
9
-
10
-
11
-
12
-
13
-
14
-
15
-
16
-
17
-
18
-
19
-
20
-
21
-
22
-
23
-
24
-
25
-
26
-
27
-
28
-
29
-
30
-
31
-
32
-
33
-
34
-
35
-
36
-
37
-
38
-
39
-
 40
40 -
 41
41 -
 42
42 -
 43
43 -
 44
44 -
 45
45 -
 46
46 -
 47
47 -
 48
48 -
 49
49 -
 50
50 -
 51
51 -
 52
52 -
 53
53 -
 54
54 -
 55
55 -
 56
56 -
 57
57 -
 58
58 -
 59
59 -
 60
60 -
61
-
62
-
63
-
64
-
65
-
66
-
67
-
68
-
69
-
70
-
71
-
72
-
73
-
74
-
75
-
76
-
77
-
78
-
79
-
80
-
81
-
82
-
83
-
84
-
85
-
86
-
87
-
88
-
89
-
90
-
91
-
92
-
93
-
94
-
95
-
96
 |
 |

42
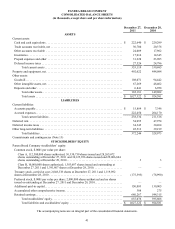
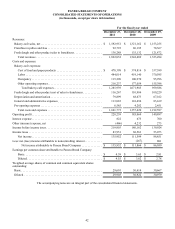
PANERA BREAD COMPANY
CONSOLIDATED STATEMENTS OF OPERATIONS
(in thousands, except per share information)
Revenues:
Bakery-cafe sales, net . . . . . . . . . . . . . . . . . . . . . . . . . . . . . . . . . . . . . . . . . .
Franchise royalties and fees . . . . . . . . . . . . . . . . . . . . . . . . . . . . . . . . . . . . .
Fresh dough and other product sales to franchisees . . . . . . . . . . . . . . . . . . .
Total revenues . . . . . . . . . . . . . . . . . . . . . . . . . . . . . . . . . . . . . . . . . . . . .
Costs and expenses:
Bakery-cafe expenses:
Cost of food and paper products . . . . . . . . . . . . . . . . . . . . . . . . . . . . . . .
Labor . . . . . . . . . . . . . . . . . . . . . . . . . . . . . . . . . . . . . . . . . . . . . . . . . . . .
Occupancy . . . . . . . . . . . . . . . . . . . . . . . . . . . . . . . . . . . . . . . . . . . . . . . .
Other operating expenses. . . . . . . . . . . . . . . . . . . . . . . . . . . . . . . . . . . . .
Total bakery-cafe expenses. . . . . . . . . . . . . . . . . . . . . . . . . . . . . . . . .
Fresh dough and other product cost of sales to franchisees . . . . . . . . . . . . .
Depreciation and amortization . . . . . . . . . . . . . . . . . . . . . . . . . . . . . . . . . . .
General and administrative expenses . . . . . . . . . . . . . . . . . . . . . . . . . . . . . .
Pre-opening expenses . . . . . . . . . . . . . . . . . . . . . . . . . . . . . . . . . . . . . . . . . .
Total costs and expenses . . . . . . . . . . . . . . . . . . . . . . . . . . . . . . . . . . . . .
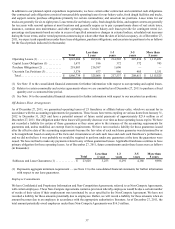
Operating profit. . . . . . . . . . . . . . . . . . . . . . . . . . . . . . . . . . . . . . . . . . . . . . . .
Interest expense. . . . . . . . . . . . . . . . . . . . . . . . . . . . . . . . . . . . . . . . . . . . . . . .
Other (income) expense, net
Income before income taxes . . . . . . . . . . . . . . . . . . . . . . . . . . . . . . . . . . . . . .
Income taxes . . . . . . . . . . . . . . . . . . . . . . . . . . . . . . . . . . . . . . . . . . . . . . . . . .
Net income. . . . . . . . . . . . . . . . . . . . . . . . . . . . . . . . . . . . . . . . . . . . . . . .
Less: net (loss) income attributable to noncontrolling interest . . . . . . . . . . . .
Net income attributable to Panera Bread Company . . . . . . . . . . . . . .
Earnings per common share attributable to Panera Bread Company:
Basic. . . . . . . . . . . . . . . . . . . . . . . . . . . . . . . . . . . . . . . . . . . . . . . . . . . . .
Diluted . . . . . . . . . . . . . . . . . . . . . . . . . . . . . . . . . . . . . . . . . . . . . . . . . . .
Weighted average shares of common and common equivalent shares
outstanding:
Basic . . . . . . . . . . . . . . . . . . . . . . . . . . . . . . . . . . . . . . . . . . . . . . . . . . . . . . .
Diluted . . . . . . . . . . . . . . . . . . . . . . . . . . . . . . . . . . . . . . . . . . . . . . . . . . . . .
For the fiscal year ended
December 27,
2011
$ 1,592,951
92,793
136,288
1,822,032
$ 470,398
484,014
115,290
216,237
1,285,939
116,267
79,899
113,083
6,585
1,601,773
220,259
822
(466)
219,903
83,951
135,952
—
$ 135,952
$ 4.59
$ 4.55
29,601
29,903
December 28,
2010
$ 1,321,162
86,195
135,132
1,542,489
$ 374,816
419,140
100,970
177,059
1,071,985
110,986
68,673
101,494
4,282
1,357,420
185,069
675
4,232
180,162
68,563
111,599
(267)
$ 111,866
$ 3.65
$ 3.62
30,614
30,922
December 29,
2009
$ 1,153,255
78,367
121,872
1,353,494
$ 337,599
370,595
95,996
155,396
959,586
100,229
67,162
83,169
2,451
1,212,597
140,897
700
273
139,924
53,073
86,851
801
$ 86,050
$ 2.81
$ 2.78
30,667
30,979
The accompanying notes are an integral part of the consolidated financial statements.