Panera Bread 2011 Annual Report Download - page 34
Download and view the complete annual report
Please find page 34 of the 2011 Panera Bread annual report below. You can navigate through the pages in the report by either clicking on the pages listed below, or by using the keyword search tool below to find specific information within the annual report.-
 1
1 -
2
-
3
-
4
-
5
-
6
-
7
-
8
-
9
-
10
-
11
-
12
-
13
-
14
-
15
-
16
-
17
-
18
-
19
-
20
-
21
-
22
-
23
-
 24
24 -
 25
25 -
 26
26 -
 27
27 -
 28
28 -
 29
29 -
 30
30 -
 31
31 -
 32
32 -
 33
33 -
 34
34 -
 35
35 -
 36
36 -
 37
37 -
 38
38 -
 39
39 -
 40
40 -
 41
41 -
 42
42 -
 43
43 -
 44
44 -
45
-
46
-
47
-
48
-
49
-
50
-
51
-
52
-
53
-
54
-
55
-
56
-
57
-
58
-
59
-
60
-
61
-
62
-
63
-
64
-
65
-
66
-
67
-
68
-
69
-
70
-
71
-
72
-
73
-
74
-
75
-
76
-
77
-
78
-
79
-
80
-
81
-
82
-
83
-
84
-
85
-
86
-
87
-
88
-
89
-
90
-
91
-
92
-
93
-
94
-
95
-
96
 |
 |

26
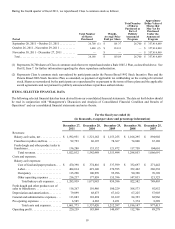
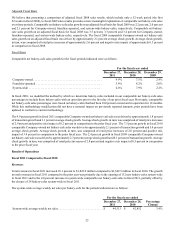
Net bakery-cafe sales in fiscal 2011 increased 20.6 percent to $1,593.0 million compared to $1,321.2 million in fiscal 2010. The
increase in net bakery-cafe sales in fiscal 2011 compared to the prior fiscal year was primarily due to the opening of 53 new
Company-owned bakery-cafes, the acquisition of 30 franchise-operated bakery-cafes, and the 4.9 percent increase in comparable
Company-owned net bakery-cafe sales in fiscal 2011, partially offset by the closure of three Company-owned bakery-cafes and
the sale of two Company-owned bakery-cafes. This 4.9 percent growth in comparable net bakery-cafe sales was driven by
approximately 1.8 percent of transaction growth and approximately 3.1 percent average check growth. Average check growth, in
turn, was comprised of retail price increases of approximately 2.9 percent and positive mix impact of approximately 0.2 percent
in comparison to the same period in the prior fiscal year. In total, Company-owned net bakery-cafe sales as a percentage of total
revenues increased by 1.7 percentage points to 87.4 percent for fiscal 2011 as compared to 85.7 percent in fiscal 2010. In addition,
the increase in average weekly net sales for Company-owned bakery-cafes in fiscal 2011 compared to the prior fiscal year was
primarily due to the previously described average check growth that resulted from retail price increases and our category
management initiatives. The average weekly net sales per Company-owned bakery-cafe and the related number of operating weeks
for the periods indicated are as follows:
Company-owned average weekly net sales. . . . . . . . . . . . . . . . . . . . . . . . . . .
Company-owned number of operating weeks . . . . . . . . . . . . . . . . . . . . . . . .
For the fiscal year ended
December 27,
2011
$ 44,071
36,140
December 28,
2010
$ 41,899
31,532
Percentage
Change
5.2%
14.6%
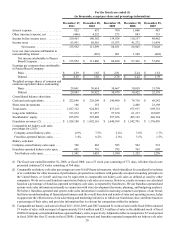
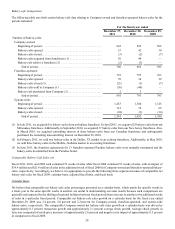
Franchise royalties and fees in fiscal 2011 increased 7.7 percent to $92.8 million compared to $86.2 million in fiscal 2010. The
components of franchise royalties and fees for the periods indicated are as follows (in thousands):
Franchise royalties . . . . . . . . . . . . . . . . . . . . . . . . . . . . . . . . . . . . . . . . . . . . . . . . . . . . . . . . . . .
Franchise fees . . . . . . . . . . . . . . . . . . . . . . . . . . . . . . . . . . . . . . . . . . . . . . . . . . . . . . . . . . . . . . .
Total . . . . . . . . . . . . . . . . . . . . . . . . . . . . . . . . . . . . . . . . . . . . . . . . . . . . . . . . . . . . . . . . . . . . .
For the fiscal year ended
December 27,
2011
$ 90,486
2,307
$ 92,793
December 28,
2010
$ 84,806
1,389
$ 86,195
The increase in franchise royalty and fee revenues in fiscal 2011 compared to the prior fiscal year was attributed to the opening
of 59 new franchise-operated bakery-cafes and the 3.4 percent increase in comparable franchise-operated net bakery-cafe sales in
fiscal 2011, partially offset by the closure of 21 franchise-operated bakery-cafe and the Company’s purchase of 30 franchise-
operated bakery-cafes. The average weekly net sales per franchise-operated bakery-cafe and the related number of operating weeks
for the periods indicated are as follows:
Franchise-operated average weekly net sales . . . . . . . . . . . . . . . . . . . . . . . . .
Franchise-operated number of operating weeks . . . . . . . . . . . . . . . . . . . . . . .
For the fiscal year ended
December 27,
2011
$ 44,527
41,058
December 28,
2010
$ 43,578
41,354
Percentage
Change
2.2 %
(0.7)%
As of December 27, 2011, there were 801 franchise-operated bakery-cafes open and we have received commitments to open 195
additional franchise-operated bakery-cafes. The timetables for opening these bakery-cafes are established in the respective Area
Development Agreements, referred to as ADAs, with franchisees, which provide for the majority of these bakery-cafes to open
in the next four to five years. An ADA requires a franchisee to develop a specified number of bakery-cafes by specified dates. If
a franchisee fails to develop bakery-cafes on the schedule set forth in the ADA, we have the right to terminate the ADA and develop
Company-owned locations or develop locations through new franchisees in that market. We may exercise one or more alternative
remedies to address defaults by franchisees, including not only development defaults, but also defaults in complying with our
operating and brand standards and other covenants included in the ADAs and franchise agreements. We may waive compliance
with certain requirements under its ADAs and franchise agreements if we determine that such action is warranted under the
particular circumstances.