Panera Bread 2011 Annual Report Download - page 27
Download and view the complete annual report
Please find page 27 of the 2011 Panera Bread annual report below. You can navigate through the pages in the report by either clicking on the pages listed below, or by using the keyword search tool below to find specific information within the annual report.-
 1
1 -
2
-
3
-
4
-
5
-
6
-
7
-
8
-
9
-
10
-
11
-
12
-
13
-
14
-
15
-
16
-
 17
17 -
 18
18 -
 19
19 -
 20
20 -
 21
21 -
 22
22 -
 23
23 -
 24
24 -
 25
25 -
 26
26 -
 27
27 -
 28
28 -
 29
29 -
 30
30 -
 31
31 -
 32
32 -
 33
33 -
 34
34 -
 35
35 -
 36
36 -
 37
37 -
38
-
39
-
40
-
41
-
42
-
43
-
44
-
45
-
46
-
47
-
48
-
49
-
50
-
51
-
52
-
53
-
54
-
55
-
56
-
57
-
58
-
59
-
60
-
61
-
62
-
63
-
64
-
65
-
66
-
67
-
68
-
69
-
70
-
71
-
72
-
73
-
74
-
75
-
76
-
77
-
78
-
79
-
80
-
81
-
82
-
83
-
84
-
85
-
86
-
87
-
88
-
89
-
90
-
91
-
92
-
93
-
94
-
95
-
96
 |
 |

19
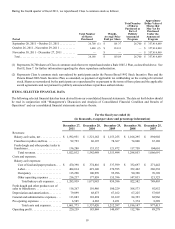
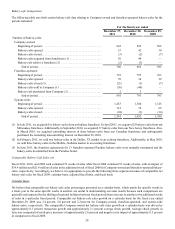
During the fourth quarter of fiscal 2011, we repurchased Class A common stock as follows:
Period
September 28, 2011 - October 25, 2011 . . . . . . . . . . .
October 26, 2011 - November 29, 2011 . . . . . . . . . . .
November 30, 2011 - December 27, 2011 . . . . . . . . .
Total . . . . . . . . . . . . . . . . . . . . . . . . . . . . . . . . . . . . . . . . . .
Total Number
of Shares
Purchased
26,700
1,468
—
28,168
(1)
(2)
Weight-
Average Price
Paid per Share
$ 101.37
$ 134.31
$—
$ 103.09
Total Number
of Shares
Purchased as
Part of
Publicly
Announced
Program
26,700
—
—
26,700
Approximate
Dollar Value of
Shares that
May Yet Be
Purchased
Under the
Announced
Program
$ 357,414,869
$ 357,414,869
$ 357,414,869
$ 357,414,869
(1) Represents 26,700 shares of Class A common stock that were repurchased under a Rule 10b5-1 Plan, as described above. See
Part II, Item 7. for further information regarding the share repurchase authorization.
(2) Represents Class A common stock surrendered by participants under the Panera Bread 1992 Stock Incentive Plan and the
Panera Bread 2006 Stock Incentive Plan, as amended, as payment of applicable tax withholding on the vesting of restricted
stock. Shares so surrendered by the participants are repurchased by us pursuant to the terms of those plans and the applicable
award agreements and not pursuant to publicly announced share repurchase authorizations.
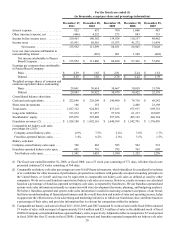
ITEM 6. SELECTED FINANCIAL DATA
The following selected financial data has been derived from our consolidated financial statements. The data set forth below should
be read in conjunction with “Management’s Discussion and Analysis of Consolidated Financial Condition and Results of
Operations” and our consolidated financial statements and notes thereto.
Revenues:
Bakery-cafe sales, net . . . . . . . . . . . . . .
Franchise royalties and fees. . . . . . . . . .
Fresh dough and other product sales to
franchisees . . . . . . . . . . . . . . . . . . . . . . .
Total revenues. . . . . . . . . . . . . . . . . .
Costs and expenses:
Bakery-cafe expenses:
Cost of food and paper products. . . .
Labor. . . . . . . . . . . . . . . . . . . . . . . . .
Occupancy . . . . . . . . . . . . . . . . . . . .
Other operating expenses . . . . . . . . .
Total bakery-cafe expenses . . . . .
Fresh dough and other product cost of
sales to franchisees. . . . . . . . . . . . . . . . . .
Depreciation and amortization. . . . . . . . .
General and administrative expenses. . . .
Pre-opening expenses. . . . . . . . . . . . . . . .
Total costs and expenses . . . . . . .
Operating profit . . . . . . . . . . . . . . . . . . . .
For the fiscal year ended (1)
(in thousands, except per share and percentage information)
December 27,
2011
$ 1,592,951
92,793
136,288
1,822,032
$ 470,398
484,014
115,290
216,237
1,285,939
116,267
79,899
113,083
6,585
1,601,773
220,259
December 28,
2010
$ 1,321,162
86,195
135,132
1,542,489
$ 374,816
419,140
100,970
177,059
1,071,985
110,986
68,673
101,494
4,282
1,357,420
185,069
December 29,
2009
$ 1,153,255
78,367
121,872
1,353,494
$ 337,599
370,595
95,996
155,396
959,586
100,229
67,162
83,169
2,451
1,212,597
140,897
December 30,
2008
$ 1,106,295
74,800
117,758
1,298,853
$ 332,697
352,462
90,390
147,033
922,582
108,573
67,225
84,393
3,374
1,186,147
112,706
December 25,
2007
$ 894,902
67,188
104,601
1,066,691
$ 271,442
286,238
70,398
121,325
749,403
92,852
57,903
68,966
8,289
977,413
89,278