Panera Bread 2011 Annual Report Download - page 38
Download and view the complete annual report
Please find page 38 of the 2011 Panera Bread annual report below. You can navigate through the pages in the report by either clicking on the pages listed below, or by using the keyword search tool below to find specific information within the annual report.-
 1
1 -
2
-
3
-
4
-
5
-
6
-
7
-
8
-
9
-
10
-
11
-
12
-
13
-
14
-
15
-
16
-
17
-
18
-
19
-
20
-
21
-
22
-
23
-
24
-
25
-
26
-
27
-
 28
28 -
 29
29 -
 30
30 -
 31
31 -
 32
32 -
 33
33 -
 34
34 -
 35
35 -
 36
36 -
 37
37 -
 38
38 -
 39
39 -
 40
40 -
 41
41 -
 42
42 -
 43
43 -
 44
44 -
 45
45 -
 46
46 -
 47
47 -
 48
48 -
49
-
50
-
51
-
52
-
53
-
54
-
55
-
56
-
57
-
58
-
59
-
60
-
61
-
62
-
63
-
64
-
65
-
66
-
67
-
68
-
69
-
70
-
71
-
72
-
73
-
74
-
75
-
76
-
77
-
78
-
79
-
80
-
81
-
82
-
83
-
84
-
85
-
86
-
87
-
88
-
89
-
90
-
91
-
92
-
93
-
94
-
95
-
96
 |
 |
30
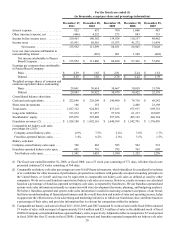
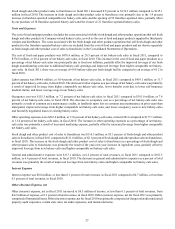
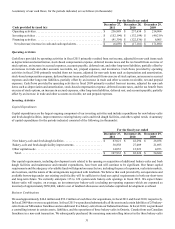
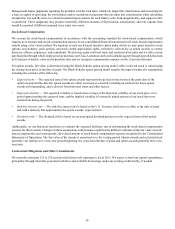
Fresh dough and other product cost of sales to franchisees was $111.0 million, or 82.1 percent of fresh dough and other product
sales to franchisees, in fiscal 2010 compared to $100.2 million, or 82.2 percent of fresh dough and other product sales to franchisees,
in fiscal 2009. The decrease in the fresh dough and other product cost of sales to franchisees as a percentage of fresh dough and
other product sales to franchisees was primarily the result of the year-over-year decrease in ingredient costs, improved leverage
from new bakery-cafes, higher comparable net bakery-cafe sales, and the Company’s purchase of 40 franchise-operated bakery-
cafes.
General and administrative expenses were $101.5 million, or 6.6 percent of total revenues, in fiscal 2010 compared to $83.2
million, or 6.1 percent of total revenues, in fiscal 2009. The increase in general and administrative expenses as a percent of total
revenues was primarily the result of investments made in our marketing infrastructure and higher incentive compensation expense
compared to the prior year driven by our fiscal 2010 performance exceeding original targets, partially offset by improved leverage
from increased revenues.
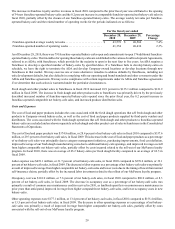
Interest Expense
Interest expense was $0.7 million, or less than 0.1 percent of total revenues, in fiscal 2010 compared to $0.7 million, or 0.1 percent
of total revenues, in fiscal 2009. The year-over-year decrease in interest expense as a percentage of total revenues was the result
of increased revenues.
Other (Income) Expense, net
Other (income) expense, net in fiscal 2010 increased to $4.2 million, or 0.3 percent of total revenues, from $0.3 million, or less
than 0.1 percent of total revenues, in fiscal 2009. Other (income) expense, net for fiscal 2010 was primarily comprised of charges
related to unclaimed property audit exposures, certain state sales tax audit exposures, and immaterial items. Other (income) expense,
net for fiscal 2009 was primarily comprised of charges related to certain state sales tax audit exposures, write-offs associated with
smallwares and panini grills, the closure of bakery-cafes, and impairment of one bakery-cafe, partially offset by a gain related to
the Columbia Strategic Cash Portfolio and the Company-owned life insurance program, and immaterial items.
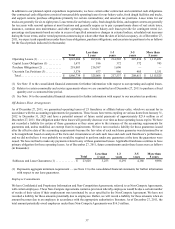
Income Taxes
The provision for income taxes increased to $68.6 million in fiscal 2010 compared to $53.1 million in fiscal 2009. The tax provision
for fiscal 2010 and fiscal 2009 reflects a combined federal, state, and local effective tax rate of 38.1 percent and 37.9 percent,
respectively. The increase in the effective tax rate between fiscal 2010 and 2009 was primarily driven by state taxes.
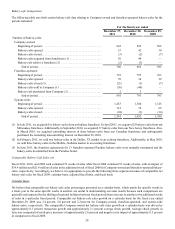
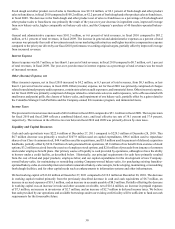
Liquidity and Capital Resources
Cash and cash equivalents were $222.6 million at December 27, 2011 compared to $229.3 million at December 28, 2010. This
$6.7 million decrease was primarily a result of $107.9 million used on capital expenditures, $96.6 million used to repurchase
shares of our Class A common stock, $44.4 million used for acquisitions, and $5.0 million used for payment of deferred acquisition
holdbacks, partially offset by $236.9 million of cash generated from operations, $5.0 million of tax benefit from exercise of stock
options, $3.2 million received from the exercise of employee stock options, and $2.0 million of proceeds from issuance of common
stock under employee benefit plans. Our primary source of liquidity is cash provided by operations, although we have the ability
to borrow under a credit facility, as described below. Historically, our principal requirements for cash have primarily resulted
from the cost of food and paper products, employee labor, and our capital expenditures for the development of new Company-
owned bakery-cafes, for maintaining or remodeling existing Company-owned bakery-cafes, for purchasing existing franchise-
operated bakery-cafes or ownership interests in other restaurant or bakery-cafe concepts, for developing, maintaining, or remodeling
fresh dough facilities, and for other capital needs such as enhancements to information systems and other infrastructure.
We had working capital of $114.8 million at December 27, 2011 compared to $119.2 million at December 28, 2010. The decrease
in working capital resulted primarily from the previously described decrease in cash and cash equivalents of $6.7 million, an
increase in accrued expenses of $18.3 million, and an increase in accounts payable of $8.5 million. Partially offsetting the decrease
in working capital was an increase in trade and other accounts receivable, net of $16.4 million, an increase in prepaid expenses
of $7.3 million, an increase in inventories of $2.7 million, and an increase of $2.7 million in deferred income taxes. We believe
that cash provided by our operations and available borrowings under our existing credit facility will be sufficient to fund our cash
requirements for the foreseeable future.