Panera Bread 2011 Annual Report Download - page 37
Download and view the complete annual report
Please find page 37 of the 2011 Panera Bread annual report below. You can navigate through the pages in the report by either clicking on the pages listed below, or by using the keyword search tool below to find specific information within the annual report.-
 1
1 -
2
-
3
-
4
-
5
-
6
-
7
-
8
-
9
-
10
-
11
-
12
-
13
-
14
-
15
-
16
-
17
-
18
-
19
-
20
-
21
-
22
-
23
-
24
-
25
-
26
-
 27
27 -
 28
28 -
 29
29 -
 30
30 -
 31
31 -
 32
32 -
 33
33 -
 34
34 -
 35
35 -
 36
36 -
 37
37 -
 38
38 -
 39
39 -
 40
40 -
 41
41 -
 42
42 -
 43
43 -
 44
44 -
 45
45 -
 46
46 -
 47
47 -
48
-
49
-
50
-
51
-
52
-
53
-
54
-
55
-
56
-
57
-
58
-
59
-
60
-
61
-
62
-
63
-
64
-
65
-
66
-
67
-
68
-
69
-
70
-
71
-
72
-
73
-
74
-
75
-
76
-
77
-
78
-
79
-
80
-
81
-
82
-
83
-
84
-
85
-
86
-
87
-
88
-
89
-
90
-
91
-
92
-
93
-
94
-
95
-
96
 |
 |

29
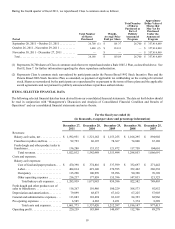
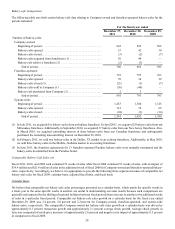
The increase in franchise royalty and fee revenues in fiscal 2010 compared to the prior fiscal year was attributed to the opening
of 34 new franchise-operated bakery-cafes and the 8.2 percent increase in comparable franchise-operated net bakery-cafe sales in
fiscal 2010, partially offset by the closure of one franchise-operated bakery-cafes. The average weekly net sales per franchise-
operated bakery-cafe and the related number of operating weeks for the periods indicated are as follows:
Franchise-operated average weekly net sales . . . . . . . . . . . . . . . . . . . . . . . . .
Franchise-operated number of operating weeks . . . . . . . . . . . . . . . . . . . . . . .
For the fiscal year ended
December 28,
2010
$ 43,578
41,354
December 29,
2009
$ 40,566
40,436
Percentage
Change
7.4%
2.3%
As of December 28, 2010, there were 791 franchise-operated bakery-cafes open and commitments to open 176 additional franchise-
operated bakery-cafes. The timetables for opening these bakery-cafes are established in the various Area Development Agreements,
referred to as ADAs, with franchisees, which provide for the majority to open in the next four to five years. An ADA requires a
franchisee to develop a specified number of bakery-cafes by specified dates. If a franchisee fails to develop bakery-cafes on
schedule, we have the right to terminate the ADA and develop Company-owned locations or develop locations through new
franchisees in that market. We may exercise one or more alternative remedies to address defaults by franchisees, including not
only development defaults, but also defaults in complying with our operating and brand standards and other covenants under the
ADAs and franchise agreements. We may waive compliance with certain requirements under its ADAs and franchise agreements
if we determine that such action is warranted under the particular circumstances.
Fresh dough and other product sales to franchisees in fiscal 2010 increased 10.9 percent to $135.1 million compared to $121.9
million in fiscal 2009. The increase in fresh dough and other product sales to franchisees was primarily driven by the previously
described increased number of franchise-operated bakery-cafes opened since the prior fiscal year, the 8.2 percent increase in
franchise-operated comparable net bakery-cafe sales, and increased produce distribution sales.
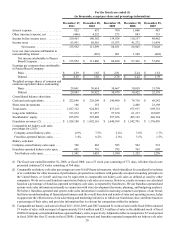
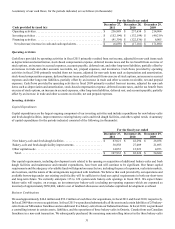
Costs and Expenses
The cost of food and paper products includes the costs associated with the fresh dough operations that sell fresh dough and other
products to Company-owned bakery-cafes, as well as the cost of food and paper products supplied by third-party vendors and
distributors. The costs associated with the fresh dough operations that sell fresh dough and other products to franchise-operated
bakery-cafes are excluded and are shown separately as fresh dough and other product cost of sales to franchisees in the Consolidated
Statements of Operations.
The cost of food and paper products was $374.8 million, or 28.4 percent of net bakery-cafe sales in fiscal 2010 compared to $337.6
million, or 29.3 percent of net bakery-cafe sales, in fiscal 2009. This decrease in the cost of food and paper products as a percentage
of net bakery-cafe sales was principally due to category management initiatives, purchasing improvements, food cost deflation,
improved leverage of our fresh dough manufacturing costs due to additional bakery-cafe openings, and improved leverage overall
from higher comparable net bakery-cafe sales, partially offset by costs incurred related to the roll-out of our MyPanera loyalty
program. In fiscal 2010, there was an average of 65.2 bakery-cafes per fresh dough facility compared to an average of 62.5 in
fiscal 2009.
Labor expense was $419.1 million, or 31.7 percent of net bakery-cafe sales, in fiscal 2010 compared to $370.6 million, or 32.1
percent of net bakery-cafe sales, in fiscal 2009. The decrease in labor expense as a percentage of net bakery-cafe sales was primarily
a result of improved leverage from higher comparable net bakery-cafe sales and lower costs due to the timing of lower than normal
self-insurance claims, partially offset by the increased labor investment related to the rollout of our MyPanera loyalty program.
Occupancy cost was $101.0 million, or 7.6 percent of net bakery-cafe sales, in fiscal 2010 compared to $96.0 million, or 8.3
percent of net bakery-cafe sales, in fiscal 2009. The decrease in occupancy cost as a percentage of net bakery-cafe sales was
primarily a result of common area maintenance credits received in 2010, as landlords spent less on common area maintenance in
prior years than anticipated, improved leverage from higher comparable net bakery-cafe sales, and lower occupancy costs in new
bakery-cafes.
Other operating expenses were $177.1 million, or 13.4 percent of net bakery-cafe sales, in fiscal 2010 compared to $155.4 million,
or 13.5 percent of net bakery-cafe sales, in fiscal 2009. The decrease in other operating expenses as a percentage of net bakery-
cafe sales was primarily a result of improved leverage from higher comparable net bakery-cafe sales, partially offset by costs
associated with the roll-out of our MyPanera loyalty program.