Panera Bread 2011 Annual Report Download - page 36
Download and view the complete annual report
Please find page 36 of the 2011 Panera Bread annual report below. You can navigate through the pages in the report by either clicking on the pages listed below, or by using the keyword search tool below to find specific information within the annual report.-
 1
1 -
2
-
3
-
4
-
5
-
6
-
7
-
8
-
9
-
10
-
11
-
12
-
13
-
14
-
15
-
16
-
17
-
18
-
19
-
20
-
21
-
22
-
23
-
24
-
25
-
 26
26 -
 27
27 -
 28
28 -
 29
29 -
 30
30 -
 31
31 -
 32
32 -
 33
33 -
 34
34 -
 35
35 -
 36
36 -
 37
37 -
 38
38 -
 39
39 -
 40
40 -
 41
41 -
 42
42 -
 43
43 -
 44
44 -
 45
45 -
 46
46 -
47
-
48
-
49
-
50
-
51
-
52
-
53
-
54
-
55
-
56
-
57
-
58
-
59
-
60
-
61
-
62
-
63
-
64
-
65
-
66
-
67
-
68
-
69
-
70
-
71
-
72
-
73
-
74
-
75
-
76
-
77
-
78
-
79
-
80
-
81
-
82
-
83
-
84
-
85
-
86
-
87
-
88
-
89
-
90
-
91
-
92
-
93
-
94
-
95
-
96
 |
 |

28
Income Taxes
The provision for income taxes increased to $84.0 million in fiscal 2011 compared to $68.6 million in fiscal 2010. The tax provision
for fiscal 2011 and fiscal 2010 reflects a combined federal, state, and local effective tax rate of 38.2 percent and 38.1 percent,
respectively. The increase in the effective tax rate between fiscal 2011 and 2010 was primarily driven by a decrease in permanent
benefits recognized in the current period relating to differences between financial and tax reporting requirements.
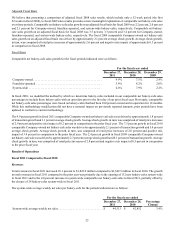
Fiscal 2010 Compared to Fiscal 2009
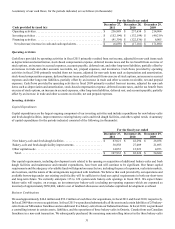
Revenues
Total revenues in fiscal 2010 increased 14.0 percent to $1,542.5 million compared to $1,353.5 million in fiscal 2009. The growth
in total revenues in fiscal 2010 compared to the prior year was primarily due to the opening of 76 new bakery-cafes system-wide
in fiscal 2010 and to the 7.9 percent increase in system-wide comparable net bakery-cafe sales in fiscal 2010, partially offset by
the closure of three bakery-cafes system-wide in fiscal 2010.
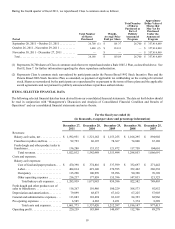
The system-wide average weekly net sales per bakery-cafe for the periods indicated are as follows:
System-wide average weekly net sales . . . . . . . . . . . . . . . . . . . . . . . . . . . . . .
For the fiscal year ended
December 28,
2010
$ 42,852
December 29,
2009
$ 39,926
Percentage
Change
7.3%
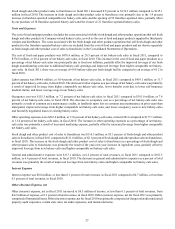
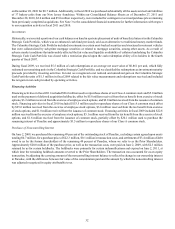
Net bakery-cafe sales in fiscal 2010 increased 14.6 percent to $1,321.2 million compared to $1,153.3 million in fiscal 2009. The
increase in net bakery-cafe sales in fiscal 2010 compared to the prior fiscal year was primarily due to the opening of 42 new
Company-owned bakery-cafes, the acquisition of 40 franchise-operated bakery-cafes, and the 7.5 percent increase in comparable
Company-owned net bakery-cafe sales in fiscal 2010, partially offset by the closure of two Company-owned bakery-cafes and the
sale of three Company-owned bakery-cafes. This 7.5 percent growth in comparable net bakery-cafe sales was driven by
approximately 2.1 percent of transaction growth and approximately 5.4 percent average check growth. Average check growth, in
turn, was comprised of retail price increases of approximately 2.0 percent and positive mix impact of approximately 3.4 percent
in comparison to the same period in the prior fiscal year. In total, Company-owned net bakery-cafe sales as a percentage of total
revenues increased 0.5 percentage points from 85.7 percent for fiscal 2010 as compared to 85.2 percent in fiscal 2009. In addition,
the increase in average weekly net sales for Company-owned bakery-cafes in fiscal 2010 compared to the prior fiscal year was
primarily due to the previously described average check growth that resulted from our category management initiative. The average
weekly net sales per Company-owned bakery-cafe and the related number of operating weeks for the periods indicated are as
follows:
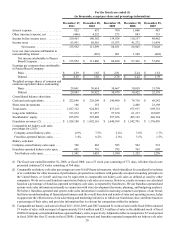
Company-owned average weekly net sales. . . . . . . . . . . . . . . . . . . . . . . . . . .
Company-owned number of operating weeks . . . . . . . . . . . . . . . . . . . . . . . .
For the fiscal year ended
December 28,
2010
$ 41,899
31,532
December 29,
2009
$ 39,050
29,533
Percentage
Change
7.3%
6.8%
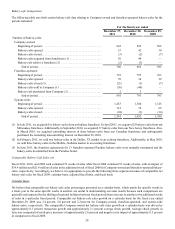
Franchise royalties and fees in fiscal 2010 increased 10.0 percent to $86.2 million compared to $78.4 million in fiscal 2009. The
components of franchise royalties and fees for the periods indicated are as follows (in thousands):
Franchise royalties . . . . . . . . . . . . . . . . . . . . . . . . . . . . . . . . . . . . . . . . . . . . . . . . . . . . . . . . . . .
Franchise fees . . . . . . . . . . . . . . . . . . . . . . . . . . . . . . . . . . . . . . . . . . . . . . . . . . . . . . . . . . . . . . .
Total . . . . . . . . . . . . . . . . . . . . . . . . . . . . . . . . . . . . . . . . . . . . . . . . . . . . . . . . . . . . . . . . . . . . .
For the fiscal year ended
December 28,
2010
$ 84,806
1,389
$ 86,195
December 29,
2009
$ 77,119
1,248
$ 78,367