Panera Bread 2011 Annual Report Download - page 79
Download and view the complete annual report
Please find page 79 of the 2011 Panera Bread annual report below. You can navigate through the pages in the report by either clicking on the pages listed below, or by using the keyword search tool below to find specific information within the annual report.-
 1
1 -
2
-
3
-
4
-
5
-
6
-
7
-
8
-
9
-
10
-
11
-
12
-
13
-
14
-
15
-
16
-
17
-
18
-
19
-
20
-
21
-
22
-
23
-
24
-
25
-
26
-
27
-
28
-
29
-
30
-
31
-
32
-
33
-
34
-
35
-
36
-
37
-
38
-
39
-
40
-
41
-
42
-
43
-
44
-
45
-
46
-
47
-
48
-
49
-
50
-
51
-
52
-
53
-
54
-
55
-
56
-
57
-
58
-
59
-
60
-
61
-
62
-
63
-
64
-
65
-
66
-
67
-
68
-
 69
69 -
 70
70 -
 71
71 -
 72
72 -
 73
73 -
 74
74 -
 75
75 -
 76
76 -
 77
77 -
 78
78 -
 79
79 -
 80
80 -
 81
81 -
 82
82 -
 83
83 -
 84
84 -
 85
85 -
 86
86 -
 87
87 -
 88
88 -
 89
89 -
90
-
91
-
92
-
93
-
94
-
95
-
96
 |
 |

71
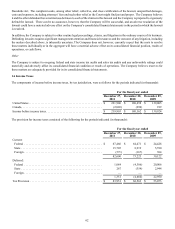
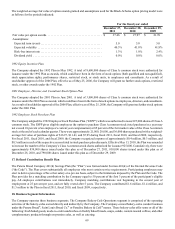
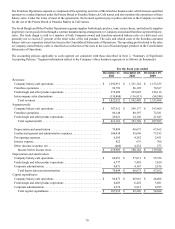
Segment assets:
Company bakery-cafe operations . . . . . . . . . . . . . . . . . . . . . . . . . . . . . . . . .
Franchise operations . . . . . . . . . . . . . . . . . . . . . . . . . . . . . . . . . . . . . . . . . . .
Fresh dough and other product operations . . . . . . . . . . . . . . . . . . . . . . . . . .
Total segment assets. . . . . . . . . . . . . . . . . . . . . . . . . . . . . . . . . . . . . . . . .
Unallocated trade and other accounts receivable . . . . . . . . . . . . . . . . . . . . .
Unallocated property and equipment . . . . . . . . . . . . . . . . . . . . . . . . . . . . . .
Unallocated deposits and other. . . . . . . . . . . . . . . . . . . . . . . . . . . . . . . . . . .
Other unallocated assets . . . . . . . . . . . . . . . . . . . . . . . . . . . . . . . . . . . . . . . .
Total assets. . . . . . . . . . . . . . . . . . . . . . . . . . . . . . . . . . . . . . . . . . . . . . . .
December 27,
2011
$ 682,246
7,502
47,710
$ 737,458
3,359
21,565
4,234
260,706
$ 1,027,322
December 28,
2010
$ 581,193
6,679
48,393
$ 636,265
9,409
19,798
4,549
254,560
$ 924,581
December 29,
2009
$ 498,806
3,850
48,616
$ 551,272
2,267
14,437
4,104
265,085
$ 837,165
“Unallocated trade and other accounts receivable” relates primarily to rebates and interest receivable, “unallocated property and
equipment” relates primarily to corporate fixed assets, “unallocated deposits and other” relates primarily to insurance deposits,
and “other unallocated assets” relates primarily to cash and cash equivalents and deferred income taxes.
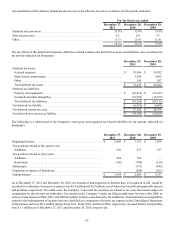
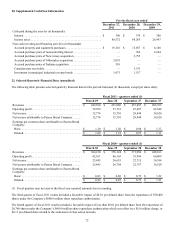
19. Earnings Per Share
The following table sets forth the computation of basic and diluted earnings per share (in thousands, except for per share data):
Amounts used for basic and diluted per share calculations:
Net income attributable to Panera Bread Company . . . . . . . . . . . . . . . . . . . .
Weighted average number of shares outstanding — basic . . . . . . . . . . . . . . .
Effect of dilutive stock-based employee compensation awards . . . . . . . . . . .
Weighted average number of shares outstanding — diluted. . . . . . . . . . . . . .
Earnings per common share attributable to Panera Bread Company:
Basic . . . . . . . . . . . . . . . . . . . . . . . . . . . . . . . . . . . . . . . . . . . . . . . . . . . . . . .
Diluted . . . . . . . . . . . . . . . . . . . . . . . . . . . . . . . . . . . . . . . . . . . . . . . . . . . . .
For the fiscal year ended
December 27,
2011
$ 135,952
29,601
302
29,903
$ 4.59
$ 4.55
December 28,
2010
$ 111,866
30,614
308
30,922
$ 3.65
$ 3.62
December 29,
2009
$ 86,050
30,667
312
30,979
$ 2.81
$ 2.78
For the fiscal years ended December 27, 2011, December 28, 2010, and December 29, 2009, weighted-average outstanding stock
options, restricted stock and stock-settled appreciation rights of less than 0.1 million, less than 0.1 million, and 0.2 million shares,
respectively, were excluded in calculating diluted earnings per share as the exercise price exceeded fair market value and inclusion
would have been anti-dilutive.