Panera Bread 2011 Annual Report Download - page 51
Download and view the complete annual report
Please find page 51 of the 2011 Panera Bread annual report below. You can navigate through the pages in the report by either clicking on the pages listed below, or by using the keyword search tool below to find specific information within the annual report.-
 1
1 -
2
-
3
-
4
-
5
-
6
-
7
-
8
-
9
-
10
-
11
-
12
-
13
-
14
-
15
-
16
-
17
-
18
-
19
-
20
-
21
-
22
-
23
-
24
-
25
-
26
-
27
-
28
-
29
-
30
-
31
-
32
-
33
-
34
-
35
-
36
-
37
-
38
-
39
-
40
-
 41
41 -
 42
42 -
 43
43 -
 44
44 -
 45
45 -
 46
46 -
 47
47 -
 48
48 -
 49
49 -
 50
50 -
 51
51 -
 52
52 -
 53
53 -
 54
54 -
 55
55 -
 56
56 -
 57
57 -
 58
58 -
 59
59 -
 60
60 -
 61
61 -
62
-
63
-
64
-
65
-
66
-
67
-
68
-
69
-
70
-
71
-
72
-
73
-
74
-
75
-
76
-
77
-
78
-
79
-
80
-
81
-
82
-
83
-
84
-
85
-
86
-
87
-
88
-
89
-
90
-
91
-
92
-
93
-
94
-
95
-
96
 |
 |

43
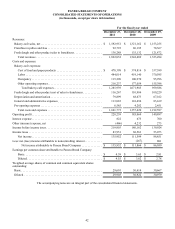
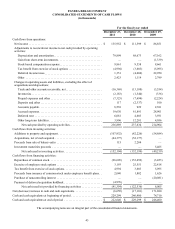
PANERA BREAD COMPANY
CONSOLIDATED STATEMENTS OF CASH FLOWS
(in thousands)
Cash flows from operations:
Net income . . . . . . . . . . . . . . . . . . . . . . . . . . . . . . . . . . . . . . . . . . . . . . . . . .
Adjustments to reconcile net income to net cash provided by operating
activities:
Depreciation and amortization. . . . . . . . . . . . . . . . . . . . . . . . . . . . . . . . .
Gain from short-term investments . . . . . . . . . . . . . . . . . . . . . . . . . . . . . .
Stock-based compensation expense. . . . . . . . . . . . . . . . . . . . . . . . . . . . .
Tax benefit from exercise of stock options . . . . . . . . . . . . . . . . . . . . . . .
Deferred income taxes . . . . . . . . . . . . . . . . . . . . . . . . . . . . . . . . . . . . . . .
Other . . . . . . . . . . . . . . . . . . . . . . . . . . . . . . . . . . . . . . . . . . . . . . . . . . . .
Changes in operating assets and liabilities, excluding the effect of
acquisitions and dispositions:
Trade and other accounts receivable, net. . . . . . . . . . . . . . . . . . . . . . . . .
Inventories . . . . . . . . . . . . . . . . . . . . . . . . . . . . . . . . . . . . . . . . . . . . . . . .
Prepaid expenses and other . . . . . . . . . . . . . . . . . . . . . . . . . . . . . . . . . . .
Deposits and other . . . . . . . . . . . . . . . . . . . . . . . . . . . . . . . . . . . . . . . . . .
Accounts payable. . . . . . . . . . . . . . . . . . . . . . . . . . . . . . . . . . . . . . . . . . .
Accrued expenses. . . . . . . . . . . . . . . . . . . . . . . . . . . . . . . . . . . . . . . . . . .
Deferred rent . . . . . . . . . . . . . . . . . . . . . . . . . . . . . . . . . . . . . . . . . . . . . .
Other long-term liabilities . . . . . . . . . . . . . . . . . . . . . . . . . . . . . . . . . . . .
Net cash provided by operating activities . . . . . . . . . . . . . . . . . . . . . .
Cash flows from investing activities:
Additions to property and equipment . . . . . . . . . . . . . . . . . . . . . . . . . . . . . .
Acquisitions, net of cash acquired . . . . . . . . . . . . . . . . . . . . . . . . . . . . . . . .
Proceeds from sale of bakery-cafes . . . . . . . . . . . . . . . . . . . . . . . . . . . . . . .
Investment maturities proceeds . . . . . . . . . . . . . . . . . . . . . . . . . . . . . . . . . .
Net cash used in investing activities . . . . . . . . . . . . . . . . . . . . . . . . . .
Cash flows from financing activities:
Repurchase of common stock. . . . . . . . . . . . . . . . . . . . . . . . . . . . . . . . . . . .
Exercise of employee stock options . . . . . . . . . . . . . . . . . . . . . . . . . . . . . . .
Tax benefit from exercise of stock options. . . . . . . . . . . . . . . . . . . . . . . . . .
Proceeds from issuance of common stock under employee benefit plans . .
Purchase of noncontrolling interest . . . . . . . . . . . . . . . . . . . . . . . . . . . . . . .
Payment of deferred acquisition holdback . . . . . . . . . . . . . . . . . . . . . . . . . .
Net cash (used in) provided by financing activities . . . . . . . . . . . . . .
Net (decrease) increase in cash and cash equivalents . . . . . . . . . . . . . . . . . . .
Cash and cash equivalents at beginning of period . . . . . . . . . . . . . . . . . . . . .
Cash and cash equivalents at end of period . . . . . . . . . . . . . . . . . . . . . . . . . .
For the fiscal year ended
December 27,
2011
$ 135,952
79,899
—
9,861
(4,994)
1,351
2,423
(16,369)
(2,183)
(7,323)
117
8,538
19,630
6,081
3,906
236,889
(107,932)
(44,377)
115
—
(152,194)
(96,605)
3,193
4,994
2,040
—
(4,976)
(91,354)
(6,659)
229,299
$ 222,640
December 28,
2010
$ 111,599
68,673
—
9,558
(3,603)
(4,660)
1,114
(13,180)
(1,540)
(7,694)
(2,337)
929
61,891
4,603
12,281
237,634
(82,226)
(52,177)
2,204
—
(132,199)
(153,492)
25,551
3,603
1,802
—
—
(122,536)
(17,101)
246,400
$ 229,299
December 29,
2009
$ 86,851
67,162
(1,339)
8,661
(5,095)
22,950
2,799
(3,554)
(336)
(2,224)
100
2,381
28,901
3,591
4,056
214,904
(54,684)
—
—
5,465
(49,219)
(3,453)
22,818
5,095
1,626
(20,081)
—
6,005
171,690
74,710
$ 246,400
The accompanying notes are an integral part of the consolidated financial statements.