Panera Bread 2011 Annual Report Download - page 52
Download and view the complete annual report
Please find page 52 of the 2011 Panera Bread annual report below. You can navigate through the pages in the report by either clicking on the pages listed below, or by using the keyword search tool below to find specific information within the annual report.-
 1
1 -
2
-
3
-
4
-
5
-
6
-
7
-
8
-
9
-
10
-
11
-
12
-
13
-
14
-
15
-
16
-
17
-
18
-
19
-
20
-
21
-
22
-
23
-
24
-
25
-
26
-
27
-
28
-
29
-
30
-
31
-
32
-
33
-
34
-
35
-
36
-
37
-
38
-
39
-
40
-
41
-
 42
42 -
 43
43 -
 44
44 -
 45
45 -
 46
46 -
 47
47 -
 48
48 -
 49
49 -
 50
50 -
 51
51 -
 52
52 -
 53
53 -
 54
54 -
 55
55 -
 56
56 -
 57
57 -
 58
58 -
 59
59 -
 60
60 -
 61
61 -
 62
62 -
63
-
64
-
65
-
66
-
67
-
68
-
69
-
70
-
71
-
72
-
73
-
74
-
75
-
76
-
77
-
78
-
79
-
80
-
81
-
82
-
83
-
84
-
85
-
86
-
87
-
88
-
89
-
90
-
91
-
92
-
93
-
94
-
95
-
96
 |
 |

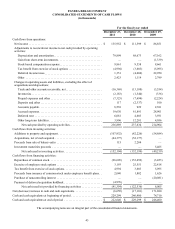
44
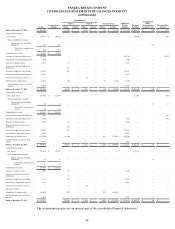
PANERA BREAD COMPANY
CONSOLIDATED STATEMENTS OF CHANGES IN EQUITY
(in thousands)
Balance, December 30, 2008 . . . . . . . . . .
Comprehensive income:
Net income . . . . . . . . . . . . . . . . . . . . . .
Other comprehensive income:
Foreign currency translation
adjustment . . . . . . . . . . . . . . . . . . .
Total other comprehensive
income . . . . . . . . . . . . . . . . . .
Comprehensive income. . . . . . . . . . . . . . .
Purchase of noncontrolling interest. . . . . .
Adjustment to noncontrolling interest. . . .
Issuance of common stock . . . . . . . . . . . .
Issuance of restricted stock (net of
forfeitures). . . . . . . . . . . . . . . . . . . . . . . . .
Exercise of employee stock options . . . . .
Stock-based compensation expense . . . . .
Conversion of Class B to Class A . . . . . . .
Repurchase of common stock . . . . . . . . . .
Tax benefit from exercise of stock
options . . . . . . . . . . . . . . . . . . . . . . . . . .
Balance, December 29, 2009 . . . . . . . . . .
Comprehensive income:
Net income (loss) . . . . . . . . . . . . . . . . .
Other comprehensive income:
Foreign currency translation
adjustment . . . . . . . . . . . . . . . . . . .
Total other comprehensive
income . . . . . . . . . . . . . . . . . .
Comprehensive income. . . . . . . . . . . . . . .
Noncontrolling interest in PB Biscuit . . . .
Purchase of noncontrolling interest. . . . . .
Issuance of common stock . . . . . . . . . . . .
Issuance of restricted stock (net of
forfeitures). . . . . . . . . . . . . . . . . . . . . . . . .
Exercise of employee stock options . . . . .
Stock-based compensation expense . . . . .
Repurchase of common stock . . . . . . . . . .
Tax benefit from exercise of stock
options . . . . . . . . . . . . . . . . . . . . . . . . . . . .
Balance, December 28, 2010 . . . . . . . . . .
Comprehensive income:
Net income . . . . . . . . . . . . . . . . . . . . . .
Other comprehensive income:
Foreign currency translation
adjustment . . . . . . . . . . . . . . . . . . .
Total other comprehensive
income . . . . . . . . . . . . . . . . . .
Comprehensive income. . . . . . . . . . . . . . .
Issuance of common stock . . . . . . . . . . . .
Issuance of restricted stock (net of
forfeitures). . . . . . . . . . . . . . . . . . . . . . . . .
Exercise of employee stock options . . . . .
Stock-based compensation expense . . . . .
Conversion of Class B to Class A . . . . . . .
Exercise of SSARs . . . . . . . . . . . . . . . . . .
Repurchase of common stock . . . . . . . . . .
Tax benefit from exercise of stock
options . . . . . . . . . . . . . . . . . . . . . . . . . . . .
Balance, December 27, 2011 . . . . . . . . . .
Total
$ 498,686
86,851
618
618
87,469
(23,124)
(742)
1,626
—
22,818
8,661
—
(3,453)
5,095
$ 597,036
111,599
64
64
111,663
630
(743)
1,802
—
25,551
9,558
(153,492)
3,603
$ 595,608
135,952
33
33
135,985
2,040
—
3,193
9,861
—
—
(96,605)
4,994
$ 655,076
Comprehensive
Income
$ 86,851
618
618
$ 87,469
$ 111,599
64
64
$ 111,663
$ 135,952
33
33
$ 135,985
Common Stock
Class A
Shares
29,422
—
—
—
—
36
165
628
—
6
(60)
—
30,197
—
—
—
—
28
132
599
—
(1,949)
—
29,007
—
—
21
93
65
—
8
1
(929)
—
28,266
Amount
$3
—
—
—
—
—
—
—
—
—
—
—
$3
—
—
—
—
—
—
—
—
—
—
$3
—
—
—
—
—
—
—
—
—
—
$3
Class B
Shares
1,398
—
—
—
—
—
—
—
—
(6)
—
—
1,392
—
—
—
—
—
—
—
—
—
—
1,392
—
—
—
—
—
—
(8)
—
—
1,384
Amount
$—
—
—
—
—
—
—
—
—
—
—
—
$—
—
—
—
—
—
—
—
—
—
—
$—
—
—
—
—
—
—
—
—
—
—
$—
Treasury Stock
Shares
136
—
—
—
—
—
—
—
—
—
32
—
168
—
—
—
—
—
—
—
—
951
—
1,119
—
—
—
—
—
—
—
—
929
—
2,048
Amount
$ (2,204)
—
—
—
—
—
—
—
—
—
(1,724)
—
$ (3,928)
—
—
—
—
—
—
—
—
(75,062)
—
$ (78,990)
—
—
—
—
—
—
—
—
(96,605)
—
$ (175,595)
Additional
Paid-in
Capital
$ 151,358
—
—
(18,799)
(742)
1,626
—
22,818
8,661
—
(1,729)
5,095
$ 168,288
—
—
—
(367)
1,802
—
25,551
9,558
(78,430)
3,603
$ 130,005
—
—
2,040
—
3,193
9,861
—
—
—
4,994
$ 150,093
Retained
Earnings
$ 346,399
86,050
—
—
—
—
—
—
—
—
—
—
$ 432,449
111,866
—
—
—
—
—
—
—
—
—
$ 544,315
135,952
—
—
—
—
—
—
—
—
—
$ 680,267
Accumulated
Other
Comprehensive
Income (Loss)
$ (394)
—
618
—
—
—
—
—
—
—
—
—
$ 224
—
51
—
—
—
—
—
—
—
—
$ 275
—
33
—
—
—
—
—
—
—
—
$ 308
Noncontrolling
Interest
$ 3,524
801
—
(4,325)
—
—
—
—
—
—
—
—
$—
(267)
13
630
(376)
—
—
—
—
—
—
$—
—
—
—
—
—
—
—
—
—
$—
The accompanying notes are an integral part of the consolidated financial statements.