Panera Bread 2011 Annual Report Download - page 33
Download and view the complete annual report
Please find page 33 of the 2011 Panera Bread annual report below. You can navigate through the pages in the report by either clicking on the pages listed below, or by using the keyword search tool below to find specific information within the annual report.-
 1
1 -
2
-
3
-
4
-
5
-
6
-
7
-
8
-
9
-
10
-
11
-
12
-
13
-
14
-
15
-
16
-
17
-
18
-
19
-
20
-
21
-
22
-
 23
23 -
 24
24 -
 25
25 -
 26
26 -
 27
27 -
 28
28 -
 29
29 -
 30
30 -
 31
31 -
 32
32 -
 33
33 -
 34
34 -
 35
35 -
 36
36 -
 37
37 -
 38
38 -
 39
39 -
 40
40 -
 41
41 -
 42
42 -
 43
43 -
44
-
45
-
46
-
47
-
48
-
49
-
50
-
51
-
52
-
53
-
54
-
55
-
56
-
57
-
58
-
59
-
60
-
61
-
62
-
63
-
64
-
65
-
66
-
67
-
68
-
69
-
70
-
71
-
72
-
73
-
74
-
75
-
76
-
77
-
78
-
79
-
80
-
81
-
82
-
83
-
84
-
85
-
86
-
87
-
88
-
89
-
90
-
91
-
92
-
93
-
94
-
95
-
96
 |
 |

25
Adjusted Fiscal Basis
We believe that presenting a comparison of adjusted fiscal 2008 sales results, which include only a 52 week period (the first
52 weeks in fiscal 2008), to fiscal 2009 sales results provides a more meaningful explanation of comparable net bakery-cafe sales
over those periods. Comparable net bakery-cafe sales growth on an adjusted fiscal basis for fiscal 2009 was 2.2 percent, 2.0 percent
and 2.1 percent for Company-owned, franchise-operated, and system-wide bakery-cafes, respectively. Comparable net bakery-
cafe sales growth on an adjusted fiscal basis for fiscal 2008 was 3.5 percent, 3.3 percent and 3.4 percent for Company-owned,
franchise-operated, and system-wide bakery-cafes, respectively. The fiscal 2009 comparable Company-owned net bakery-cafe
sales growth on an adjusted fiscal basis was driven by approximately 2.1 percent average check growth. Average check growth,
in turn, was comprised of retail price increases of approximately 2.6 percent and negative mix impact of approximately 0.5 percent
in comparison to fiscal 2008.
Fiscal Basis
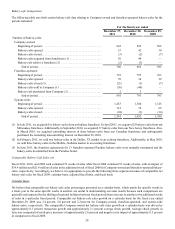
Comparable net bakery-cafe sales growth for the fiscal periods indicated were as follows:
Company-owned . . . . . . . . . . . . . . . . . . . . . . . . . . . . . . . . . . . . . . . . . . . . . . .
Franchise-operated . . . . . . . . . . . . . . . . . . . . . . . . . . . . . . . . . . . . . . . . . . . . .
System-wide . . . . . . . . . . . . . . . . . . . . . . . . . . . . . . . . . . . . . . . . . . . . . . . . . .
For the fiscal year ended
December 27,
2011
4.9%
3.4%
4.0%
December 28,
2010
7.5%
8.2%
7.9%
December 29,
2009
2.4%
2.0%
2.2%
In fiscal 2010, we modified the method by which we determine bakery-cafes included in our comparable net bakery-cafe sales
percentages to include those bakery-cafes with an open date prior to the first day of our prior fiscal year. Previously, comparable
net bakery-cafe sales percentages were based on bakery-cafes that had been 100 percent owned and in operation for 18 months.
While this methodology modification did not have a material impact on previously reported amounts, prior periods have been
updated to conform to current methodology.
The 4.9 percent growth in fiscal 2011 comparable Company-owned net bakery-cafe sales was driven by approximately 1.8 percent
of transaction growth and 3.1 percent average check growth. Average check growth, in turn, was comprised of retail price increases
of 2.9 percent and positive mix impact of 0.2 percent in comparison to the prior fiscal year. The 7.5 percent growth in fiscal 2010
comparable Company-owned net bakery-cafe sales was driven by approximately 2.1 percent of transaction growth and 5.4 percent
average check growth. Average check growth, in turn, was comprised of retail price increases of 2.0 percent and positive mix
impact of 3.4 percent in comparison to the prior fiscal year. The 2.4 percent growth in fiscal 2009 comparable Company-owned
net bakery-cafe sales was driven by approximately 2.3 percent average check growth and 0.1 percent of transaction growth. Average
check growth, in turn, was comprised of retail price increases of 2.8 percent and negative mix impact of 0.5 percent in comparison
to the prior fiscal year.
Results of Operations
Fiscal 2011 Compared to Fiscal 2010
Revenues
Total revenues in fiscal 2011 increased 18.1 percent to $1,822.0 million compared to $1,542.5 million in fiscal 2010. The growth
in total revenues in fiscal 2011 compared to the prior year was primarily due to the opening of 112 new bakery-cafes system-wide
in fiscal 2011 and to the 4.0 percent increase in system-wide comparable net bakery-cafe sales in fiscal 2011, partially offset by
the closure of 24 bakery-cafes system-wide in fiscal 2011.
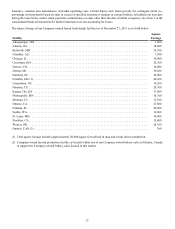
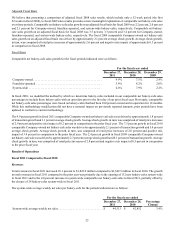
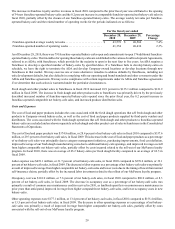
The system-wide average weekly net sales per bakery-cafe for the periods indicated are as follows:
System-wide average weekly net sales . . . . . . . . . . . . . . . . . . . . . . . . . . . . . .
For the fiscal year ended
December 27,
2011
$ 44,313
December 28,
2010
$ 42,852
Percentage
Change
3.4%