Panera Bread 2011 Annual Report Download - page 39
Download and view the complete annual report
Please find page 39 of the 2011 Panera Bread annual report below. You can navigate through the pages in the report by either clicking on the pages listed below, or by using the keyword search tool below to find specific information within the annual report.-
 1
1 -
2
-
3
-
4
-
5
-
6
-
7
-
8
-
9
-
10
-
11
-
12
-
13
-
14
-
15
-
16
-
17
-
18
-
19
-
20
-
21
-
22
-
23
-
24
-
25
-
26
-
27
-
28
-
 29
29 -
 30
30 -
 31
31 -
 32
32 -
 33
33 -
 34
34 -
 35
35 -
 36
36 -
 37
37 -
 38
38 -
 39
39 -
 40
40 -
 41
41 -
 42
42 -
 43
43 -
 44
44 -
 45
45 -
 46
46 -
 47
47 -
 48
48 -
 49
49 -
50
-
51
-
52
-
53
-
54
-
55
-
56
-
57
-
58
-
59
-
60
-
61
-
62
-
63
-
64
-
65
-
66
-
67
-
68
-
69
-
70
-
71
-
72
-
73
-
74
-
75
-
76
-
77
-
78
-
79
-
80
-
81
-
82
-
83
-
84
-
85
-
86
-
87
-
88
-
89
-
90
-
91
-
92
-
93
-
94
-
95
-
96
 |
 |

31
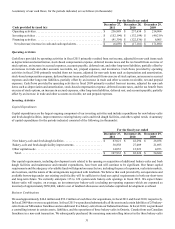
A summary of our cash flows, for the periods indicated, are as follows (in thousands):
Cash provided by (used in):
Operating activities . . . . . . . . . . . . . . . . . . . . . . . . . . . . . . . . . . . . . . . . . . . . .
Investing activities . . . . . . . . . . . . . . . . . . . . . . . . . . . . . . . . . . . . . . . . . . . . .
Financing activities . . . . . . . . . . . . . . . . . . . . . . . . . . . . . . . . . . . . . . . . . . . . .
Net (decrease) increase in cash and cash equivalents. . . . . . . . . . . . . . . . . .
For the fiscal year ended
December 27,
2011
$ 236,889
$(152,194)
$(91,354)
$(6,659)
December 28,
2010
$ 237,634
$(132,199)
$(122,536)
$(17,101)
December 29,
2009
$ 214,904
$(49,219)
$ 6,005
$ 171,690
Operating Activities
Cash flows provided by operating activities in fiscal 2011 primarily resulted from net income, adjusted for non-cash items such
as depreciation and amortization, stock-based compensation expense, deferred income taxes and the tax benefit from exercise of
stock options, an increase in accrued expenses, accounts payable, deferred rent, and other long-term liabilities, partially offset by
an increase in trade and other accounts receivable, net, prepaid expenses, and inventories. Cash flows provided by operating
activities in fiscal 2010 primarily resulted from net income, adjusted for non-cash items such as depreciation and amortization,
stock-based compensation expense, deferred income taxes and the tax benefit from exercise of stock options, an increase in accrued
expenses and other long-term liabilities, partially offset by an increase in trade and other accounts receivable, net and prepaid
expenses. Cash flows provided by operating activities in fiscal 2009 primarily resulted from net income, adjusted for non-cash
items such as depreciation and amortization, stock-based compensation expense, deferred income taxes, and the tax benefit from
exercise of stock options, an increase in accrued expenses, other long-term liabilities, deferred rent, and accounts payable, partially
offset by an increase in trade and other accounts receivable, net and prepaid expenses.
Investing Activities
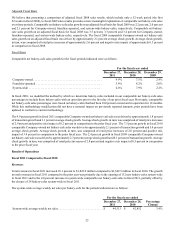
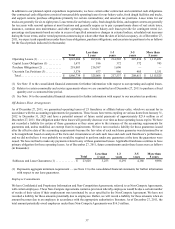
Capital Expenditures
Capital expenditures are the largest ongoing component of our investing activities and include expenditures for new bakery-cafes
and fresh dough facilities, improvements to existing bakery-cafes and fresh dough facilities, and other capital needs. A summary
of capital expenditures for the periods indicated consisted of the following (in thousands):
New bakery-cafe and fresh dough facilities . . . . . . . . . . . . . . . . . . . . . . . . . .
Bakery-cafe and fresh dough facility improvements . . . . . . . . . . . . . . . . . . .
Other capital needs . . . . . . . . . . . . . . . . . . . . . . . . . . . . . . . . . . . . . . . . . . . . .
Total . . . . . . . . . . . . . . . . . . . . . . . . . . . . . . . . . . . . . . . . . . . . . . . . . . . . . . .
For the fiscal year ended
December 27,
2011
$ 63,021
30,858
14,053
$ 107,932
December 28,
2010
$ 42,294
27,009
12,923
$ 82,226
December 29,
2009
$ 28,036
21,695
4,953
$ 54,684
Our capital requirements, including development costs related to the opening or acquisition of additional bakery-cafes and fresh
dough facilities and maintenance and remodel expenditures, have been and will continue to be significant. Our future capital
requirements and the adequacy of available funds will depend on many factors, including the pace of expansion, real estate markets,
site locations, and the nature of the arrangements negotiated with landlords. We believe that cash provided by our operations and
available borrowings under our existing credit facility will be sufficient to fund our capital requirements in both our short-term
and long-term future. We currently anticipate 115 to 120 system-wide bakery-cafe openings in fiscal 2012. We expect future
bakery-cafes will require, on average, an investment per bakery-cafe (excluding pre-opening expenses which are expensed as
incurred) of approximately $950,000, which is net of landlord allowances and excludes capitalized development overhead.
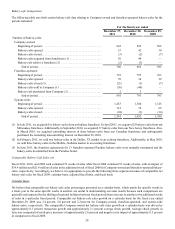
Business Combinations
We used approximately $44.4 million and $52.2 million of cash flows for acquisitions, in fiscal 2011 and fiscal 2010, respectively.
In fiscal 2009 there were no acquisitions. In fiscal 2011 we purchased substantially all the assets and certain liabilities of 25 bakery-
cafes from our Milwaukee franchisee and an additional five bakery-cafes from our Indiana franchisee. In fiscal 2010, we purchased
a controlling interest in certain assets, liabilities, and the operations of three bakery-cafes in Ontario, Canada from our Canadian
franchisee in a non-cash transaction. We subsequently purchased the remaining noncontrolling interest in the three bakery-cafes