Panera Bread 2011 Annual Report Download - page 75
Download and view the complete annual report
Please find page 75 of the 2011 Panera Bread annual report below. You can navigate through the pages in the report by either clicking on the pages listed below, or by using the keyword search tool below to find specific information within the annual report.-
 1
1 -
2
-
3
-
4
-
5
-
6
-
7
-
8
-
9
-
10
-
11
-
12
-
13
-
14
-
15
-
16
-
17
-
18
-
19
-
20
-
21
-
22
-
23
-
24
-
25
-
26
-
27
-
28
-
29
-
30
-
31
-
32
-
33
-
34
-
35
-
36
-
37
-
38
-
39
-
40
-
41
-
42
-
43
-
44
-
45
-
46
-
47
-
48
-
49
-
50
-
51
-
52
-
53
-
54
-
55
-
56
-
57
-
58
-
59
-
60
-
61
-
62
-
63
-
64
-
 65
65 -
 66
66 -
 67
67 -
 68
68 -
 69
69 -
 70
70 -
 71
71 -
 72
72 -
 73
73 -
 74
74 -
 75
75 -
 76
76 -
 77
77 -
 78
78 -
 79
79 -
 80
80 -
 81
81 -
 82
82 -
 83
83 -
 84
84 -
 85
85 -
86
-
87
-
88
-
89
-
90
-
91
-
92
-
93
-
94
-
95
-
96
 |
 |

67
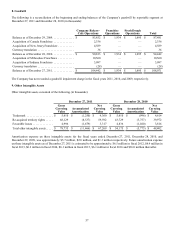
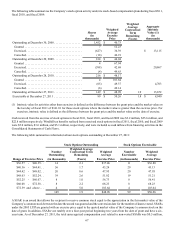
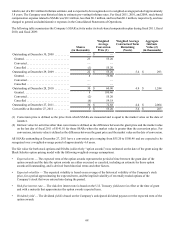
The following table summarizes the Company’s stock option activity under its stock-based compensation plans during fiscal 2011,
fiscal 2010, and fiscal 2009:
Outstanding at December 30, 2008 . . . . . . . . . . . . . . . . . . .
Granted . . . . . . . . . . . . . . . . . . . . . . . . . . . . . . . . . . . . . . .
Exercised. . . . . . . . . . . . . . . . . . . . . . . . . . . . . . . . . . . . . .
Cancelled. . . . . . . . . . . . . . . . . . . . . . . . . . . . . . . . . . . . . .
Outstanding at December 29, 2009 . . . . . . . . . . . . . . . . . . .
Granted . . . . . . . . . . . . . . . . . . . . . . . . . . . . . . . . . . . . . . .
Exercised. . . . . . . . . . . . . . . . . . . . . . . . . . . . . . . . . . . . . .
Cancelled. . . . . . . . . . . . . . . . . . . . . . . . . . . . . . . . . . . . . .
Outstanding at December 28, 2010 . . . . . . . . . . . . . . . . . . .
Granted . . . . . . . . . . . . . . . . . . . . . . . . . . . . . . . . . . . . . . .
Exercised. . . . . . . . . . . . . . . . . . . . . . . . . . . . . . . . . . . . . .
Cancelled. . . . . . . . . . . . . . . . . . . . . . . . . . . . . . . . . . . . . .
Outstanding at December 27, 2011 . . . . . . . . . . . . . . . . . . .
Exercisable at December 27, 2011 . . . . . . . . . . . . . . . . . . .
Shares
(in
thousands)
1,452
7
(627)
(18)
814
4
(598)
(4)
216
4
(65)
(6)
149
99
Weighted
Average
Exercise
Price
$ 40.73
52.23
36.39
46.91
$ 44.04
67.94
42.68
49.63
$ 48.17
103.64
49.37
49.14
$ 48.98
$ 50.26
Weighted
Average
Contractual
Term
Remaining
(Years)
1.9
1.8
Aggregate
Intrinsic
Value (1)
(in
thousands)
$ 13,115
20,867
4,703
13,672
$ 8,940
(1) Intrinsic value for activities other than exercises is defined as the difference between the grant price and the market value on
the last day of fiscal 2011 of $141.01 for those stock options where the market value is greater than the exercise price. For
exercises, intrinsic value is defined as the difference between the grant price and the market value on the date of exercise.
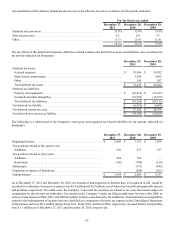
Cash received from the exercise of stock options in fiscal 2011, fiscal 2010, and fiscal 2009 was $3.2 million, $25.6 million, and
$22.8 million respectively. Windfall tax benefits realized from exercised stock options in fiscal 2011, fiscal 2010, and fiscal 2009
were $5.0 million, $3.6 million, and $5.1 million, respectively, and were included as cash inflows from financing activities in the
Consolidated Statements of Cash Flows.
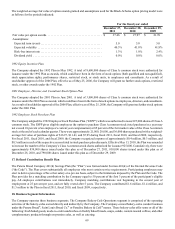
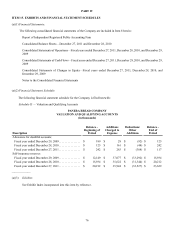
The following table summarizes information about stock options outstanding at December 27, 2011:
Range of Exercise Price
$36.57
$40.36
$44.42
$48.03
$52.25
$60.08
$72.59
-
-
-
-
-
-
and
$40.35 . .
$44.41 . .
$48.02 . .
$52.24 . .
$60.07 . .
$72.58 . .
above. . .
Stock Options Outstanding
Number
Outstanding
(in thousands)
14
56
20
39
8
8
4
149
Weighted Average
Contractual Term
Remaining
(Years)
2.1
1.7
0.6
2.6
1.0
2.2
5.0
1.9
Weighted
Average
Exercise Price
$37.46
43.24
47.95
51.02
56.73
68.23
103.64
$48.98
Stock Options Exercisable
Number
Exercisable
(in thousands)
11
29
20
19
8
8
4
99
Weighted
Average
Exercise Price
$36.80
43.13
47.95
51.21
56.41
68.23
103.64
$50.26
A SSAR is an award that allows the recipient to receive common stock equal to the appreciation in the fair market value of the
Company’s common stock between the date the award was granted and the conversion date for the number of shares vested. SSARs
under the 2005 LTIP are granted with an exercise price equal to the quoted market value of the Company’s common stock on the
date of grant. In addition, SSARs vest ratably over a four-year period beginning two years from the date of grant and have a six-
year term. As of December 27, 2011, the total unrecognized compensation cost related to non-vested SSARs was $0.5 million,