Panera Bread 2011 Annual Report Download - page 35
Download and view the complete annual report
Please find page 35 of the 2011 Panera Bread annual report below. You can navigate through the pages in the report by either clicking on the pages listed below, or by using the keyword search tool below to find specific information within the annual report.-
 1
1 -
2
-
3
-
4
-
5
-
6
-
7
-
8
-
9
-
10
-
11
-
12
-
13
-
14
-
15
-
16
-
17
-
18
-
19
-
20
-
21
-
22
-
23
-
24
-
 25
25 -
 26
26 -
 27
27 -
 28
28 -
 29
29 -
 30
30 -
 31
31 -
 32
32 -
 33
33 -
 34
34 -
 35
35 -
 36
36 -
 37
37 -
 38
38 -
 39
39 -
 40
40 -
 41
41 -
 42
42 -
 43
43 -
 44
44 -
 45
45 -
46
-
47
-
48
-
49
-
50
-
51
-
52
-
53
-
54
-
55
-
56
-
57
-
58
-
59
-
60
-
61
-
62
-
63
-
64
-
65
-
66
-
67
-
68
-
69
-
70
-
71
-
72
-
73
-
74
-
75
-
76
-
77
-
78
-
79
-
80
-
81
-
82
-
83
-
84
-
85
-
86
-
87
-
88
-
89
-
90
-
91
-
92
-
93
-
94
-
95
-
96
 |
 |
27
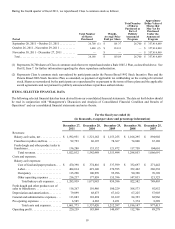
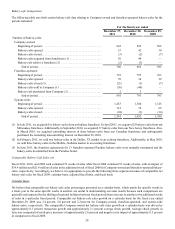
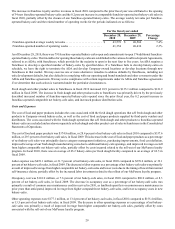
Fresh dough and other product sales to franchisees in fiscal 2011 increased 0.9 percent to $136.3 million compared to $135.1
million in fiscal 2010. The increase in fresh dough and other product sales to franchisees was primarily due to the 3.4 percent
increase in franchise-operated comparable net bakery-cafe sales and the opening of 59 franchise-operated cafes, partially offset
by our purchase of 30 franchise-operated bakery-cafes and the closure of 21 franchise-operated bakery-cafes.
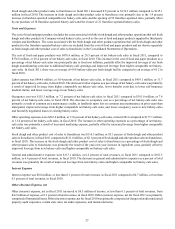
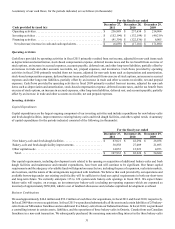
Costs and Expenses
The cost of food and paper products includes the costs associated with the fresh dough and other product operations that sell fresh
dough and other products to Company-owned bakery-cafes, as well as the cost of food and paper products supplied by third-party
vendors and distributors. The costs associated with the fresh dough and other product operations that sell fresh dough and other
products to the franchise-operated bakery-cafes are excluded from the cost of food and paper products and are shown separately
as fresh dough and other product cost of sales to franchisees in the Consolidated Statements of Operations.
The cost of food and paper products was $470.4 million, or 29.5 percent of net bakery-cafe sales in fiscal 2011, compared to
$374.8 million, or 28.4 percent of net bakery-cafe sales, in fiscal 2010. This increase in the cost of food and paper products as a
percentage of net bakery-cafe sales was principally due to food cost inflation, partially offset by improved leverage of our fresh
dough manufacturing costs due to additional bakery-cafe openings and improved leverage from higher comparable net bakery-
cafe sales. In fiscal 2011, there was an average of 69.6 bakery-cafes per fresh dough facility compared to an average of 65.2 in
fiscal 2010.
Labor expense was $484.0 million, or 30.4 percent of net bakery-cafe sales, in fiscal 2011 compared to $419.1 million, or 31.7
percent of net bakery-cafe sales, in fiscal 2010. The decrease in labor expense as a percentage of net bakery-cafe sales was primarily
a result of improved leverage from higher comparable net bakery-cafe sales, lower benefits costs due to lower self-insurance
medical claims, and lower average wage in our bakery-cafes.
Occupancy cost was $115.3 million, or 7.2 percent of net bakery-cafe sales, in fiscal 2011 compared to $101.0 million, or 7.6
percent of net bakery-cafe sales, in fiscal 2010. The decrease in occupancy cost as a percentage of net bakery-cafe sales was
primarily a result of common area maintenance credits, as landlords spent less on common area maintenance in prior years than
anticipated, improved leverage from higher comparable net bakery-cafe sales, and lower occupancy costs in new bakery-cafes
and favorably negotiated leases in existing bakery-cafes.
Other operating expenses were $216.2 million, or 13.6 percent of net bakery-cafe sales, in fiscal 2011 compared to $177.1 million,
or 13.4 percent of net bakery-cafe sales, in fiscal 2010. The increase in other operating expenses as a percentage of net bakery-
cafe sales was primarily a result of increased marketing expense, partially offset by increased leverage from higher comparable
net bakery-cafe sales.
Fresh dough and other product cost of sales to franchisees was $116.3 million, or 85.3 percent of fresh dough and other product
sales to franchisees, in fiscal 2011 compared to $111.0 million, or 82.1 percent of fresh dough and other product sales to franchisees,
in fiscal 2010. The increase in the fresh dough and other product cost of sales to franchisees as a percentage of fresh dough and
other product sales to franchisees was primarily the result of the year-over-year increase in ingredient costs, partially offset by
improved leverage from new bakery-cafes and higher comparable net bakery-cafe sales.
General and administrative expenses were $113.1 million, or 6.2 percent of total revenues, in fiscal 2011 compared to $101.5
million, or 6.6 percent of total revenues, in fiscal 2010. The decrease in general and administrative expenses as a percent of total
revenues was primarily the result of improved leverage from new bakery-cafes and higher comparable net bakery-cafe sales.
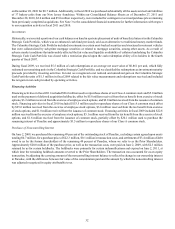
Interest Expense
Interest expense was $0.8 million, or less than 0.1 percent of total revenues, in fiscal 2011 compared to $0.7 million, or less than
0.1 percent of total revenues, in fiscal 2010.
Other (Income) Expense, net
Other (income) expense, net in fiscal 2011 increased to $0.5 million of income, or less than 0.1 percent of total revenues, from
$4.2 million of expense, or 0.3 percent of total revenues, in fiscal 2010. Other (income) expense, net for fiscal 2011 was primarily
comprised of immaterial items. Other (income) expense, net for fiscal 2010 was primarily comprised of charges related to unclaimed
property audit exposures, certain state sales tax audit exposures, and immaterial items.