Panera Bread 2011 Annual Report Download - page 76
Download and view the complete annual report
Please find page 76 of the 2011 Panera Bread annual report below. You can navigate through the pages in the report by either clicking on the pages listed below, or by using the keyword search tool below to find specific information within the annual report.-
 1
1 -
2
-
3
-
4
-
5
-
6
-
7
-
8
-
9
-
10
-
11
-
12
-
13
-
14
-
15
-
16
-
17
-
18
-
19
-
20
-
21
-
22
-
23
-
24
-
25
-
26
-
27
-
28
-
29
-
30
-
31
-
32
-
33
-
34
-
35
-
36
-
37
-
38
-
39
-
40
-
41
-
42
-
43
-
44
-
45
-
46
-
47
-
48
-
49
-
50
-
51
-
52
-
53
-
54
-
55
-
56
-
57
-
58
-
59
-
60
-
61
-
62
-
63
-
64
-
65
-
 66
66 -
 67
67 -
 68
68 -
 69
69 -
 70
70 -
 71
71 -
 72
72 -
 73
73 -
 74
74 -
 75
75 -
 76
76 -
 77
77 -
 78
78 -
 79
79 -
 80
80 -
 81
81 -
 82
82 -
 83
83 -
 84
84 -
 85
85 -
 86
86 -
87
-
88
-
89
-
90
-
91
-
92
-
93
-
94
-
95
-
96
 |
 |

68
which is net of a $0.1 million forfeiture estimate, and is expected to be recognized over a weighted-average period of approximately
3.8 years. The Company uses historical data to estimate pre-vesting forfeiture rates. For fiscal 2011, 2010, and 2009, stock-based
compensation expense related to SSARs was $0.1 million, less than $0.1 million, and less than $0.1 million, respectively, and was
charged to general and administrative expenses in the Consolidated Statements of Operations.
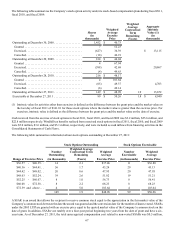
The following table summarizes the Company’s SSAR activity under its stock-based compensation plan during fiscal 2011, fiscal
2010, and fiscal 2009:
Outstanding at December 30, 2008 . . . . . . . . . .
Granted . . . . . . . . . . . . . . . . . . . . . . . . . . . . . . .
Converted . . . . . . . . . . . . . . . . . . . . . . . . . . . . .
Cancelled . . . . . . . . . . . . . . . . . . . . . . . . . . . . .
Outstanding at December 29, 2009 . . . . . . . . . .
Granted . . . . . . . . . . . . . . . . . . . . . . . . . . . . . . .
Converted . . . . . . . . . . . . . . . . . . . . . . . . . . . . .
Cancelled . . . . . . . . . . . . . . . . . . . . . . . . . . . . .
Outstanding at December 28, 2010 . . . . . . . . . .
Granted . . . . . . . . . . . . . . . . . . . . . . . . . . . . . . .
Converted . . . . . . . . . . . . . . . . . . . . . . . . . . . . .
Cancelled . . . . . . . . . . . . . . . . . . . . . . . . . . . . .
Outstanding at December 27, 2011. . . . . . . . . . .
Convertible at December 27, 2011 . . . . . . . . . . .
Shares
(in thousands)
—
23
—
(1)
22
8
—
—
30
8
(2)
(6)
30
3
Weighted
Average
Conversion
Price (1)
$—
55.20
—
55.20
$ 55.20
75.80
—
—
$ 60.90
100.46
55.20
59.18
$ 72.68
$ 55.20
Weighted Average
Contractual Term
Remaining
(Years)
5.6
4.9
4.4
3.6
Aggregate
Intrinsic
Value (2)
(in thousands)
$ 293
$ 1,244
$ 2,064
$ 263
(1) Conversion price is defined as the price from which SSARs are measured and is equal to the market value on the date of
issuance.
(2) Intrinsic value for activities other than conversions is defined as the difference between the grant price and the market value
on the last day of fiscal 2011 of $141.01 for those SSARs where the market value is greater than the conversion price. For
conversions, intrinsic value is defined as the difference between the grant price and the market value on the date of conversion.
All SSARs outstanding at December 27, 2011 have a conversion price ranging from $55.20 to $100.46 and are expected to be
recognized over a weighted-average period of approximately 4.4 years.
The fair value for both stock options and SSARs (collectively “option awards”) was estimated on the date of the grant using the
Black-Scholes option pricing model with the following weighted-average assumptions:
•Expected term — The expected term of the option awards represents the period of time between the grant date of the
option awards and the date the option awards are either exercised or canceled, including an estimate for those option
awards still outstanding, and is derived from historical terms and other factors.
•Expected volatility — The expected volatility is based on an average of the historical volatility of the Company’s stock
price, for a period approximating the expected term, and the implied volatility of externally traded options of the
Company’s stock that were entered into during the period.
•Risk-free interest rate — The risk-free interest rate is based on the U.S. Treasury yield curve in effect at the time of grant
and with a maturity that approximates the option awards expected term.
•Dividend yield — The dividend yield is based on the Company’s anticipated dividend payout over the expected term of the
option awards.