North Face 2015 Annual Report Download - page 94
Download and view the complete annual report
Please find page 94 of the 2015 North Face annual report below. You can navigate through the pages in the report by either clicking on the pages listed below, or by using the keyword search tool below to find specific information within the annual report.-
 1
1 -
2
-
3
-
4
-
5
-
6
-
7
-
8
-
9
-
10
-
11
-
12
-
13
-
14
-
15
-
16
-
17
-
18
-
19
-
20
-
21
-
22
-
23
-
24
-
25
-
26
-
27
-
28
-
29
-
30
-
31
-
32
-
33
-
34
-
35
-
36
-
37
-
38
-
39
-
40
-
41
-
42
-
43
-
44
-
45
-
46
-
47
-
48
-
49
-
50
-
51
-
52
-
53
-
54
-
55
-
56
-
57
-
58
-
59
-
60
-
61
-
62
-
63
-
64
-
65
-
66
-
67
-
68
-
69
-
70
-
71
-
72
-
73
-
74
-
75
-
76
-
77
-
78
-
79
-
80
-
81
-
82
-
83
-
 84
84 -
 85
85 -
 86
86 -
 87
87 -
 88
88 -
 89
89 -
 90
90 -
 91
91 -
 92
92 -
 93
93 -
 94
94 -
 95
95 -
 96
96 -
 97
97 -
 98
98 -
 99
99 -
 100
100 -
 101
101 -
 102
102 -
 103
103 -
 104
104 -
105
-
106
-
107
-
108
-
109
-
110
-
111
-
112
-
113
-
114
-
115
-
116
-
117
-
118
-
119
-
120
-
121
-
122
-
123
-
124
-
125
-
126
-
127
-
128
-
129
-
130
 |
 |
VF CORPORATION
Notes to Consolidated Financial Statements
December 2015
the financial institution is included in other income (expense), net, and was $1.9 million in 2015, $1.7 million in
2014 and $1.8 million in 2013. Net proceeds of this program are classified in operating activities in the
Consolidated Statements of Cash Flows.
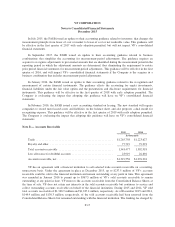
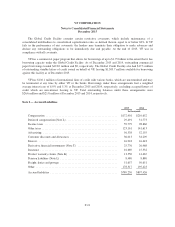
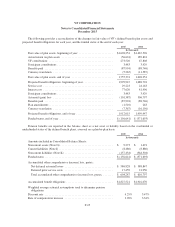
Note C — Inventories
2015 2014
In thousands
Finished products ............................................ $1,352,572 $1,232,623
Work in process .............................................. 102,557 104,517
Raw materials ............................................... 156,865 145,664
Total inventories ............................................. $1,611,994 $1,482,804
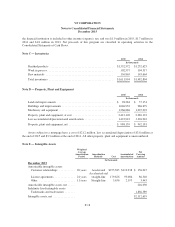
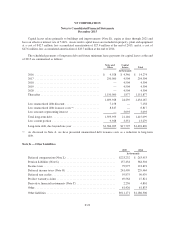
Note D — Property, Plant and Equipment
2015 2014
In thousands
Land and improvements ....................................... $ 98,284 $ 57,151
Buildings and improvements .................................... 1,046,932 986,679
Machinery and equipment ...................................... 1,266,886 1,225,293
Property, plant and equipment, at cost ............................ 2,412,102 2,269,123
Less accumulated depreciation and amortization .................... 1,423,943 1,326,942
Property, plant and equipment, net ............................... $ 988,159 $ 942,181
Assets subject to a mortgage have a cost of $21.2 million, less accumulated depreciation of $3.8 million at
the end of 2015 and $3.3 million at the end of 2014. All other property, plant and equipment is unencumbered.
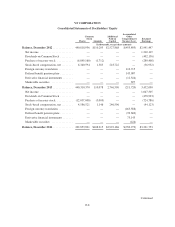
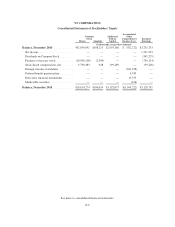
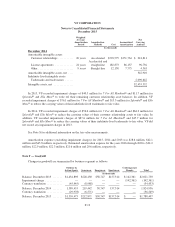
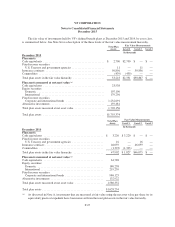
Note E — Intangible Assets
Weighted
Average
Amortization
Period
Amortization
Methods Cost
Accumulated
Amortization
Net
Carrying
Amount
In thousands
December 2015
Amortizable intangible assets:
Customer relationships ........... 20years Accelerated $275,385 $119,338 $ 156,047
License agreements .............. 24years
Accelerated and
straight-line 179,626 93,086 86,540
Other ......................... 11years Straight-line 5,636 2,193 3,443
Amortizable intangible assets, net ..... 246,030
Indefinite-lived intangible assets:
Trademarks and trade names ....... 1,866,589
Intangible assets, net ............... $2,112,619
F-18