North Face 2015 Annual Report Download - page 52
Download and view the complete annual report
Please find page 52 of the 2015 North Face annual report below. You can navigate through the pages in the report by either clicking on the pages listed below, or by using the keyword search tool below to find specific information within the annual report.-
 1
1 -
2
-
3
-
4
-
5
-
6
-
7
-
8
-
9
-
10
-
11
-
12
-
13
-
14
-
15
-
16
-
17
-
18
-
19
-
20
-
21
-
22
-
23
-
24
-
25
-
26
-
27
-
28
-
29
-
30
-
31
-
32
-
33
-
34
-
35
-
36
-
37
-
38
-
39
-
40
-
41
-
 42
42 -
 43
43 -
 44
44 -
 45
45 -
 46
46 -
 47
47 -
 48
48 -
 49
49 -
 50
50 -
 51
51 -
 52
52 -
 53
53 -
 54
54 -
 55
55 -
 56
56 -
 57
57 -
 58
58 -
 59
59 -
 60
60 -
 61
61 -
 62
62 -
63
-
64
-
65
-
66
-
67
-
68
-
69
-
70
-
71
-
72
-
73
-
74
-
75
-
76
-
77
-
78
-
79
-
80
-
81
-
82
-
83
-
84
-
85
-
86
-
87
-
88
-
89
-
90
-
91
-
92
-
93
-
94
-
95
-
96
-
97
-
98
-
99
-
100
-
101
-
102
-
103
-
104
-
105
-
106
-
107
-
108
-
109
-
110
-
111
-
112
-
113
-
114
-
115
-
116
-
117
-
118
-
119
-
120
-
121
-
122
-
123
-
124
-
125
-
126
-
127
-
128
-
129
-
130
 |
 |

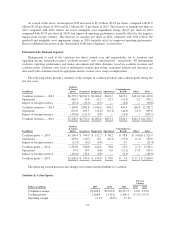
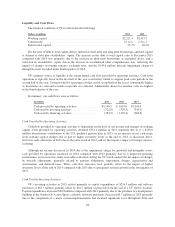
Liquidity and Cash Flows
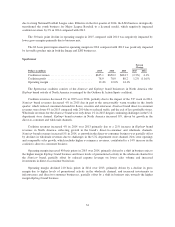
The financial condition of VF is reflected in the following:
Dollars in millions 2015 2014
Working capital .................................................. $2,221.4 $2,417.5
Current ratio .................................................... 2.1to1 2.5to1
Debt to total capital ............................................... 25.7% 20.4%
For the ratio of debt to total capital, debt is defined as short-term and long-term borrowings, and total capital
is defined as debt plus stockholders’ equity. The increase in the debt to total capital ratio at December 2015
compared with 2014 was primarily due to the increase in short-term borrowings as explained above, and a
reduction in stockholders’ equity due to the increase in accumulated other comprehensive loss, reflecting the
impact of changes in foreign currency exchange rates, and the $143.6 million noncash impairment charge of
intangible assets recorded in the fourth quarter of 2015.
VF’s primary source of liquidity is the strong annual cash flow provided by operating activities. Cash from
operations is typically lower in the first half of the year as inventory builds to support peak sales periods in the
second half of the year. Cash provided by operating activities in the second half of the year is substantially higher
as inventories are sold and accounts receivable are collected. Additionally, direct-to-consumer sales are highest
in the fourth quarter of the year.
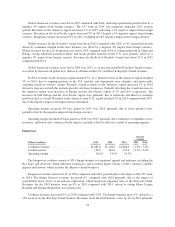
In summary, our cash flows were as follows:
In millions 2015 2014 2013
Cash provided by operating activities .............. $1,146.5 $ 1,697.6 $1,506.0
Cash used by investing activities .................. (322.8) (329.3) (350.3)
Cash used by financing activities .................. (783.3) (1,107.4) (983.8)
Cash Provided by Operating Activities
Cash flow provided by operating activities is dependent on the level of net income and changes in working
capital. Cash provided by operating activities declined $551.1 million in 2015 primarily due to i) a $250.0
million discretionary contribution to the U.S. qualified pension plan in 2015, ii) an increase in net cash usage
from working capital changes due in part to higher inventory levels at the end of 2015 as discussed above,
iii) lower cash collections in 2015 due to the extra week in 2014, and iv) the negative impact of foreign currency
exchange.
Although net income decreased in 2014 due to the impairment charge for goodwill and intangible assets,
cash provided by operations increased in 2014 compared with 2013 primarily due to i) improved operating
performance, ii) increased accounts receivable collections during the 53rd week, and iii) the net impact of changes
in noncash adjustments, primarily related to pension obligations, impairment charges, depreciation and
amortization, and deferred taxes. These cash flow increases were partially offset by the impact of higher
inventory levels at the end of 2014 compared with 2013 due to anticipated revenue growth in the first quarter of
2015.
Cash Used by Investing Activities
VF’s investing activities in 2015 related primarily to capital expenditures of $254.5 million and software
purchases of $63.3 million, partially offset by $16.7 million of proceeds from the sale of a VF Outlet®location.
Capital expenditures increased $20.4 million compared with 2014 primarily due to the purchase of a headquarters
building in the Outdoor & Action Sports coalition. Software purchases decreased $4.7 million in 2015 primarily
due to the completion of a major system implementation that incurred significant costs throughout 2014 and
38