North Face 2015 Annual Report Download - page 112
Download and view the complete annual report
Please find page 112 of the 2015 North Face annual report below. You can navigate through the pages in the report by either clicking on the pages listed below, or by using the keyword search tool below to find specific information within the annual report.-
 1
1 -
2
-
3
-
4
-
5
-
6
-
7
-
8
-
9
-
10
-
11
-
12
-
13
-
14
-
15
-
16
-
17
-
18
-
19
-
20
-
21
-
22
-
23
-
24
-
25
-
26
-
27
-
28
-
29
-
30
-
31
-
32
-
33
-
34
-
35
-
36
-
37
-
38
-
39
-
40
-
41
-
42
-
43
-
44
-
45
-
46
-
47
-
48
-
49
-
50
-
51
-
52
-
53
-
54
-
55
-
56
-
57
-
58
-
59
-
60
-
61
-
62
-
63
-
64
-
65
-
66
-
67
-
68
-
69
-
70
-
71
-
72
-
73
-
74
-
75
-
76
-
77
-
78
-
79
-
80
-
81
-
82
-
83
-
84
-
85
-
86
-
87
-
88
-
89
-
90
-
91
-
92
-
93
-
94
-
95
-
96
-
97
-
98
-
99
-
100
-
101
-
 102
102 -
 103
103 -
 104
104 -
 105
105 -
 106
106 -
 107
107 -
 108
108 -
 109
109 -
 110
110 -
 111
111 -
 112
112 -
 113
113 -
 114
114 -
 115
115 -
 116
116 -
 117
117 -
 118
118 -
 119
119 -
 120
120 -
 121
121 -
 122
122 -
123
-
124
-
125
-
126
-
127
-
128
-
129
-
130
 |
 |

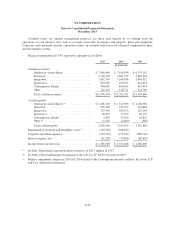
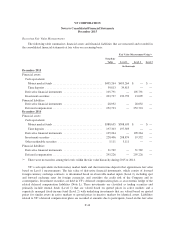
VF CORPORATION
Notes to Consolidated Financial Statements
December 2015
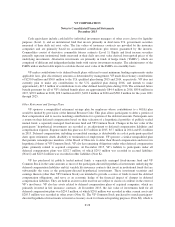
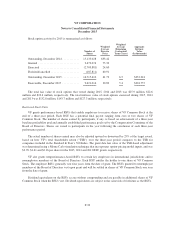
Foreign rate differences include tax benefits of $28.4 million, $11.2 million and $6.9 million in 2015, 2014
and 2013, respectively, from favorable audit outcomes on certain tax matters and from expiration of statutes of
limitations.
VF was granted a ruling which lowered the effective income tax rate on taxable earnings for years 2010
through 2014 under Belgium’s excess profit tax regime. This lower rate, when compared with the country’s
statutory rate, resulted in an income tax reduction of $14.9 million ($0.03 per diluted share) in 2014 and
$10.4 million ($0.02 per diluted share) in 2013. In February 2015, the European Union Commission (“EU”)
opened a state aid investigation into Belgium’s rulings. On January 11, 2016, the EU announced its decision that
these rulings were illegal and ordered that tax benefits granted under these rulings should be collected from the
affected companies, including VF. If this matter is adversely resolved, the Belgian government may be required
to assess, and VF may be required to pay, past taxes reflective of the disallowed alleged state aid that VF
received in years 2010 through 2014. VF is currently assessing its legal options and the impact that an adverse
outcome would have on the Company’s financial statements in future periods, but does not expect the impact to
be material.
In addition, VF has been granted a lower effective income tax rate on taxable earnings in another foreign
jurisdiction for the years 2010 through 2019. This lower rate, when compared with the country’s statutory rate,
resulted in income tax reductions of $3.2 million ($.01 per diluted share) in 2015, $6.0 million ($0.01 per diluted
share) in 2014 and $3.3 million ($0.01 per diluted share) in 2013.
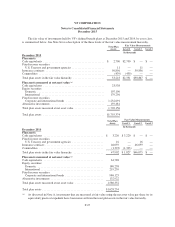
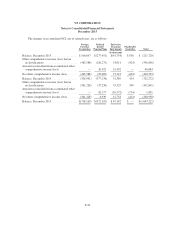
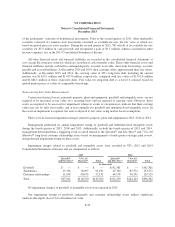
Deferred income tax assets and liabilities consisted of the following:
2015 2014
In thousands
Deferred income tax assets:
Inventories ................................................. $ 38,897 $ 34,430
Employee compensation and benefits ............................ 252,307 257,187
Other accrued expenses ....................................... 154,337 186,390
Operating loss carryforwards ................................... 139,634 115,259
Gross deferred income tax assets .............................. 585,175 593,266
Valuation allowances ......................................... (100,951) (96,802)
Net deferred income tax assets .................................. 484,224 496,464
Deferred income tax liabilities:
Depreciation ................................................ 27,756 624
Intangible assets ............................................. 591,615 652,950
Other deferred tax liabilities .................................... 67,016 22,923
Deferred income tax liabilities .................................. 686,387 676,497
Net deferred income tax assets (liabilities) .......................... $(202,163) $(180,033)
Amounts included in the Consolidated Balance Sheets (a):
Noncurrent assets (Note G) .................................... $ 39,246 $ 49,431
Noncurrent liabilities (Note K) .................................. (241,409) (229,464)
$(202,163) $(180,033)
(a) As discussed in Note A , we have presented all deferred tax assets and liabilities as noncurrent.
F-36