North Face 2015 Annual Report Download - page 43
Download and view the complete annual report
Please find page 43 of the 2015 North Face annual report below. You can navigate through the pages in the report by either clicking on the pages listed below, or by using the keyword search tool below to find specific information within the annual report.-
 1
1 -
2
-
3
-
4
-
5
-
6
-
7
-
8
-
9
-
10
-
11
-
12
-
13
-
14
-
15
-
16
-
17
-
18
-
19
-
20
-
21
-
22
-
23
-
24
-
25
-
26
-
27
-
28
-
29
-
30
-
31
-
32
-
 33
33 -
 34
34 -
 35
35 -
 36
36 -
 37
37 -
 38
38 -
 39
39 -
 40
40 -
 41
41 -
 42
42 -
 43
43 -
 44
44 -
 45
45 -
 46
46 -
 47
47 -
 48
48 -
 49
49 -
 50
50 -
 51
51 -
 52
52 -
 53
53 -
54
-
55
-
56
-
57
-
58
-
59
-
60
-
61
-
62
-
63
-
64
-
65
-
66
-
67
-
68
-
69
-
70
-
71
-
72
-
73
-
74
-
75
-
76
-
77
-
78
-
79
-
80
-
81
-
82
-
83
-
84
-
85
-
86
-
87
-
88
-
89
-
90
-
91
-
92
-
93
-
94
-
95
-
96
-
97
-
98
-
99
-
100
-
101
-
102
-
103
-
104
-
105
-
106
-
107
-
108
-
109
-
110
-
111
-
112
-
113
-
114
-
115
-
116
-
117
-
118
-
119
-
120
-
121
-
122
-
123
-
124
-
125
-
126
-
127
-
128
-
129
-
130
 |
 |

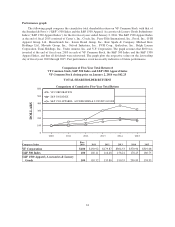
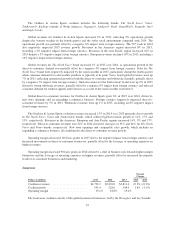
VF reported revenue growth of 8% in 2014, driven by a 13% increase in the Outdoor & Action Sports
coalition, and continued strength in the international and direct-to-consumer businesses. The extra week in 2014
added approximately 1% of growth compared to 2013. Additional details on revenues are provided in the section
titled “Information by Business Segment”.
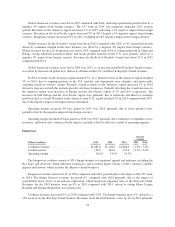
VF’s most significant foreign currency exposure relates to business conducted in euro-based countries.
However, VF conducts business in other developed and emerging markets around the world with exposure to
foreign currencies other than the euro. The strengthening of the U.S. dollar relative to foreign currencies
negatively impacted revenue comparisons in 2015 as discussed above.
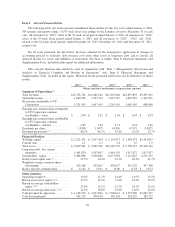
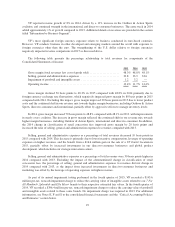
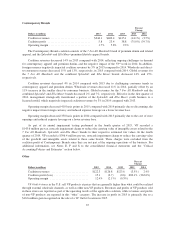
The following table presents the percentage relationship to total revenues for components of the
Consolidated Statements of Income:
2015 2014 2013
Gross margin (total revenues less cost of goods sold) ..................... 48.3% 48.8% 48.1%
Selling, general and administrative expenses ............................ 33.8 33.9 33.6
Impairment of goodwill and intangible assets ........................... 1.2 3.2 —
Operating income ................................................. 13.4% 11.7% 14.4%
Gross margin declined 50 basis points to 48.3% in 2015 compared with 48.8% in 2014 primarily due to
foreign currency exchange rate fluctuations, which negatively impacted gross margin by 80 basis points in 2015
compared with 2014. Excluding this impact, gross margin improved 30 basis points in 2015 due to lower product
costs and the continued shift in our revenue mix towards higher margin businesses, including Outdoor & Action
Sports, direct-to-consumer and international, partially offset by aggressive efforts to manage inventory levels.
In 2014, gross margin increased 70 basis points to 48.8% compared with 48.1% in 2013, with improvements
in nearly every coalition. The increase in gross margin reflected the continued shift in our revenue mix towards
higher margin businesses, including Outdoor & Action Sports, international and direct-to-consumer. In addition,
the 2014 change in classification of retail concession fees improved gross margin by 20 basis points and
increased the ratio of selling, general and administration expenses to revenues compared with 2013.
Selling, general and administrative expenses as a percentage of total revenues decreased 10 basis points in
2015 compared with 2014. This decrease is primarily due to lower incentive compensation, leverage of operating
expenses on higher revenues, and the benefit from a $16.6 million gain on the sale of a VF Outlet®location in
2015, partially offset by increased investments in our direct-to-consumer businesses and global product
development, which includes our strategic innovation centers.
Selling, general and administrative expenses as a percentage of total revenues were 30 basis points higher in
2014 compared with 2013. Excluding the impact of the aforementioned change in classification of retail
concession fees, the percentage of selling, general and administrative expenses to revenues did not change in
2014 compared with 2013, as the impact from increased investments in direct-to-consumer businesses and
marketing was offset by the leverage of operating expenses on higher revenues.
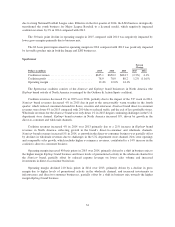
As part of its annual impairment testing performed in the fourth quarter of 2015, VF recorded a $143.6
million pre-tax, noncash impairment charge to reduce the carrying value of intangible assets related to our 7 For
All Mankind®,Splendid®and Ella Moss®brands to their respective estimated fair values. In the fourth quarter of
2014, VF recorded a $396.4 million pre-tax, noncash impairment charge to reduce the carrying value of goodwill
and intangible assets related to these same brands. No impairment charge was required in 2013. For additional
information, see Notes E, F and S to the consolidated financial statements and the “Critical Accounting Policies
and Estimates” section below.
29