North Face 2015 Annual Report Download - page 38
Download and view the complete annual report
Please find page 38 of the 2015 North Face annual report below. You can navigate through the pages in the report by either clicking on the pages listed below, or by using the keyword search tool below to find specific information within the annual report.-
 1
1 -
2
-
3
-
4
-
5
-
6
-
7
-
8
-
9
-
10
-
11
-
12
-
13
-
14
-
15
-
16
-
17
-
18
-
19
-
20
-
21
-
22
-
23
-
24
-
25
-
26
-
27
-
 28
28 -
 29
29 -
 30
30 -
 31
31 -
 32
32 -
 33
33 -
 34
34 -
 35
35 -
 36
36 -
 37
37 -
 38
38 -
 39
39 -
 40
40 -
 41
41 -
 42
42 -
 43
43 -
 44
44 -
 45
45 -
 46
46 -
 47
47 -
 48
48 -
49
-
50
-
51
-
52
-
53
-
54
-
55
-
56
-
57
-
58
-
59
-
60
-
61
-
62
-
63
-
64
-
65
-
66
-
67
-
68
-
69
-
70
-
71
-
72
-
73
-
74
-
75
-
76
-
77
-
78
-
79
-
80
-
81
-
82
-
83
-
84
-
85
-
86
-
87
-
88
-
89
-
90
-
91
-
92
-
93
-
94
-
95
-
96
-
97
-
98
-
99
-
100
-
101
-
102
-
103
-
104
-
105
-
106
-
107
-
108
-
109
-
110
-
111
-
112
-
113
-
114
-
115
-
116
-
117
-
118
-
119
-
120
-
121
-
122
-
123
-
124
-
125
-
126
-
127
-
128
-
129
-
130
 |
 |
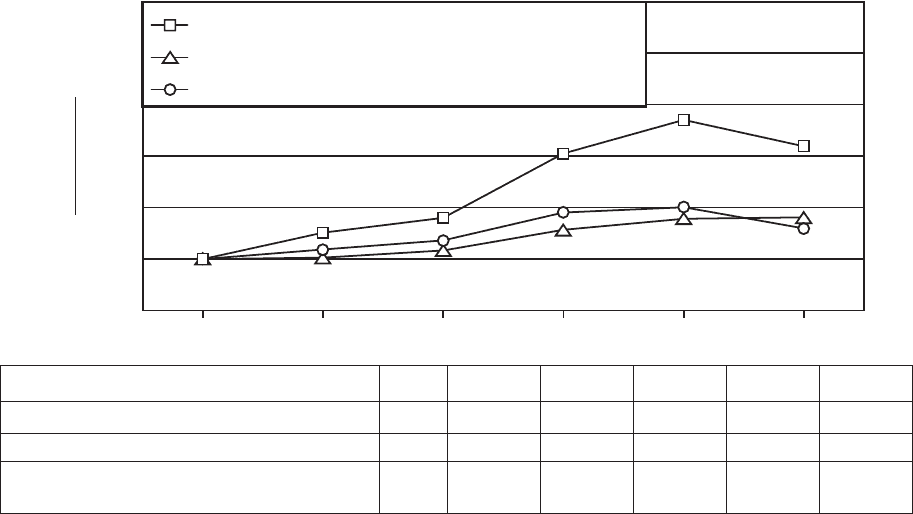
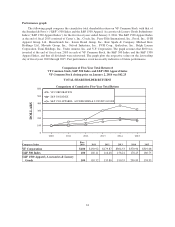
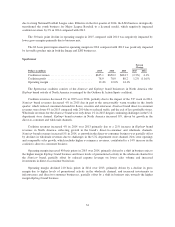
Performance graph:
The following graph compares the cumulative total shareholder return on VF Common Stock with that of
the Standard & Poor’s (“S&P”) 500 Index and the S&P 1500 Apparel, Accessories & Luxury Goods Subindustry
Index (“S&P 1500 Apparel Index”) for the five fiscal years ended January 2, 2016. The S&P 1500 Apparel Index
at the end of fiscal 2015 consisted of Carter’s, Inc., Coach, Inc., Perry Ellis International, Inc., Fossil, Inc., G-III
Apparel Group, Ltd., Hanesbrands Inc., Iconix Brand Group, Inc., Kate Spade & Company, Michael Kors
Holdings Ltd., Movado Group, Inc., Oxford Industries, Inc., PVH Corp., Quiksilver, Inc., Ralph Lauren
Corporation, Tumi Holdings, Inc., Under Armour, Inc. and V.F. Corporation. The graph assumes that $100 was
invested at the end of fiscal year 2010 in each of VF Common Stock, the S&P 500 Index and the S&P 1500
Apparel Index, and that all dividends were reinvested. The graph plots the respective values on the last trading
day of fiscal years 2010 through 2015. Past performance is not necessarily indicative of future performance.
Comparison of Five-Year Total Return of
VF Common Stock, S&P 500 Index and S&P 1500 Apparel Index
VF Common Stock closing price on January 2, 2016 was $62.25
TOTAL SHAREHOLDER RETURNS
Comparison of Cumulative Five-Year Total Return
201520142013201220112010
0
DOLLARS
VF CORPORATION
S&P 500 INDEX
S&P 1500 APPAREL, ACCESSORIES & LUXURY GOODS
100
200
300
400
600
500
Company / Index
Base
2010 2011 2012 2013 2014 2015
VF Corporation $100 $150.92 $179.87 $304.53 $370.96 $319.08
S&P 500 Index 100 102.11 116.48 156.21 178.25 180.75
S&P 1500 Apparel, Accessories & Luxury
Goods 100 118.32 135.80 190.55 200.83 158.95
24