North Face 2015 Annual Report Download - page 51
Download and view the complete annual report
Please find page 51 of the 2015 North Face annual report below. You can navigate through the pages in the report by either clicking on the pages listed below, or by using the keyword search tool below to find specific information within the annual report.-
 1
1 -
2
-
3
-
4
-
5
-
6
-
7
-
8
-
9
-
10
-
11
-
12
-
13
-
14
-
15
-
16
-
17
-
18
-
19
-
20
-
21
-
22
-
23
-
24
-
25
-
26
-
27
-
28
-
29
-
30
-
31
-
32
-
33
-
34
-
35
-
36
-
37
-
38
-
39
-
40
-
 41
41 -
 42
42 -
 43
43 -
 44
44 -
 45
45 -
 46
46 -
 47
47 -
 48
48 -
 49
49 -
 50
50 -
 51
51 -
 52
52 -
 53
53 -
 54
54 -
 55
55 -
 56
56 -
 57
57 -
 58
58 -
 59
59 -
 60
60 -
 61
61 -
62
-
63
-
64
-
65
-
66
-
67
-
68
-
69
-
70
-
71
-
72
-
73
-
74
-
75
-
76
-
77
-
78
-
79
-
80
-
81
-
82
-
83
-
84
-
85
-
86
-
87
-
88
-
89
-
90
-
91
-
92
-
93
-
94
-
95
-
96
-
97
-
98
-
99
-
100
-
101
-
102
-
103
-
104
-
105
-
106
-
107
-
108
-
109
-
110
-
111
-
112
-
113
-
114
-
115
-
116
-
117
-
118
-
119
-
120
-
121
-
122
-
123
-
124
-
125
-
126
-
127
-
128
-
129
-
130
 |
 |
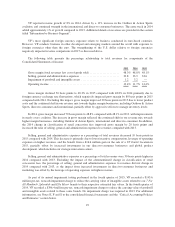
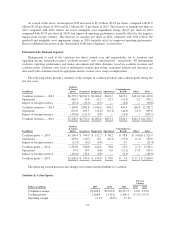
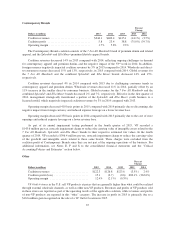
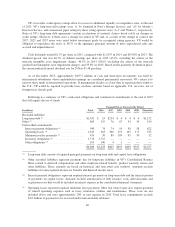
International Operations
International revenues declined 4% in 2015 compared with growth of 9% in 2014. The decline in 2015 is
due to foreign currency, which negatively impacted international revenue growth by 13%. Revenues in Europe
declined 11%, reflecting operational growth that was more than offset by a 16% negative impact from foreign
currency. In the Asia Pacific region, revenues increased 9% primarily driven by strong growth in China. Foreign
currency negatively impacted growth in the Asia Pacific region by 4%. Revenues in the Americas (non-U.S.)
region decreased 1%, as weakening currencies in the region relative to the U.S. dollar negatively impacted
growth by 15%. International revenues represented 36% and 38% of total VF revenues in 2015 and 2014,
respectively.
Direct-to-Consumer Operations
Direct-to-consumer revenues grew 3% in 2015 compared with growth of 19% in 2014. The increase in 2015
was driven by operational growth in all regions and growth in nearly every brand with a retail format. The direct-
to-consumer revenue increase in 2015 was partially offset by a negative 4% impact from foreign currency
(primarily in Europe), and a negative 3% impact from the additional week included in the 2014 results. New
store openings and comparable sales growth, which includes an expanding e-commerce business, all contributed
to direct-to-consumer revenue growth. VF opened 186 stores in 2015, bringing the total number of VF-owned
retail stores to 1,520 at December 2015. Direct-to-consumer revenues were 27% of total VF revenues in 2015
compared with 26% in 2014.
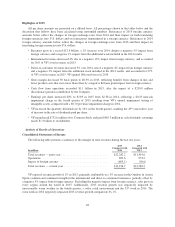
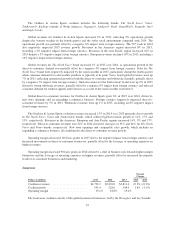
Analysis of Financial Condition
Balance Sheets
The following discussion refers to significant changes in balances at December 2015 compared with
December 2014:
•Increase in inventory — primarily due to lower consumer demand for cold-weather products in the fourth
quarter of 2015 as a result of the unseasonably warm weather.
•Decrease in intangible assets — driven by (i) impairment charges for 7 For All Mankind®and Splendid®
and Ella Moss®to reduce the carrying values of their intangible assets to fair value, (ii) the impact of
foreign currency fluctuations, and (iii) amortization expense. See Notes E and S to the consolidated
financial statements for additional information.
•Increase in short-term borrowings — due to commercial paper borrowings needed to support general
corporate purposes and the $250.0 million discretionary pension contribution in 2015.
•Decrease in accrued liabilities — primarily due to lower incentive compensation accruals, and the timing
of payments for other accruals and income taxes.
•Decrease in other liabilities — primarily due to an improvement in the funded status of the U.S. qualified
pension plan, resulting from a $250.0 million discretionary pension contribution in 2015.
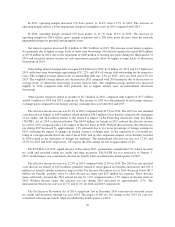
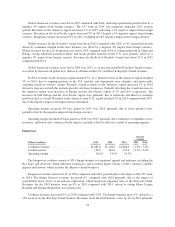
The funded status of the defined benefit pension plans is reflected in the balance sheet as the excess (or
deficiency) of pension plan assets compared with projected benefit obligations payable to plan participants. The
underfunded status of the defined benefit pension plans was $156.6 million at the end of 2015 compared with
$371.7 million at the end of 2014. The underfunded status includes a $126.9 million liability related to our
unfunded U.S. nonqualified defined benefit plan, $34.3 million of net liabilities related to our non-U.S. defined
benefit plans, and a $4.6 million asset related to our U.S. qualified defined benefit plan. The improvement in the
funded status as of December 2015 was due to i) an increase in plan assets resulting from a $250.0 million
discretionary contribution in 2015, partially offset by a lower return on plan assets, and ii) a decrease in projected
benefit obligations caused primarily by higher discount rates. See the “Critical Accounting Policies and
Estimates” section below and Note L to the consolidated financial statements for additional discussion of the
defined benefit pension plans.
37