North Face 2015 Annual Report Download - page 101
Download and view the complete annual report
Please find page 101 of the 2015 North Face annual report below. You can navigate through the pages in the report by either clicking on the pages listed below, or by using the keyword search tool below to find specific information within the annual report.-
 1
1 -
2
-
3
-
4
-
5
-
6
-
7
-
8
-
9
-
10
-
11
-
12
-
13
-
14
-
15
-
16
-
17
-
18
-
19
-
20
-
21
-
22
-
23
-
24
-
25
-
26
-
27
-
28
-
29
-
30
-
31
-
32
-
33
-
34
-
35
-
36
-
37
-
38
-
39
-
40
-
41
-
42
-
43
-
44
-
45
-
46
-
47
-
48
-
49
-
50
-
51
-
52
-
53
-
54
-
55
-
56
-
57
-
58
-
59
-
60
-
61
-
62
-
63
-
64
-
65
-
66
-
67
-
68
-
69
-
70
-
71
-
72
-
73
-
74
-
75
-
76
-
77
-
78
-
79
-
80
-
81
-
82
-
83
-
84
-
85
-
86
-
87
-
88
-
89
-
90
-
 91
91 -
 92
92 -
 93
93 -
 94
94 -
 95
95 -
 96
96 -
 97
97 -
 98
98 -
 99
99 -
 100
100 -
 101
101 -
 102
102 -
 103
103 -
 104
104 -
 105
105 -
 106
106 -
 107
107 -
 108
108 -
 109
109 -
 110
110 -
 111
111 -
112
-
113
-
114
-
115
-
116
-
117
-
118
-
119
-
120
-
121
-
122
-
123
-
124
-
125
-
126
-
127
-
128
-
129
-
130
 |
 |

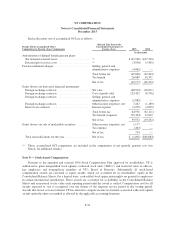
VF CORPORATION
Notes to Consolidated Financial Statements
December 2015
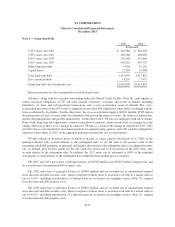
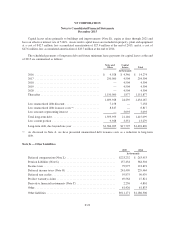
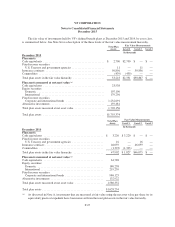
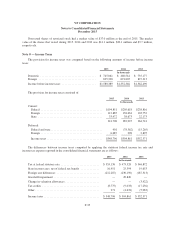
The following provides a reconciliation of the changes in fair value of VF’s defined benefit plan assets and
projected benefit obligations for each year, and the funded status at the end of each year:
2015 2014
In thousands
Fair value of plan assets, beginning of year ........................ $1,628,254 $1,467,526
Actual return on plan assets .................................... (56,624) 189,824
VF contributions ............................................. 273,520 67,808
Participant contributions ....................................... 3,483 3,429
Benefits paid ................................................ (87,994) (88,746)
Currency translation .......................................... (5,265) (11,587)
Fair value of plan assets, end of year ............................. 1,755,374 1,628,254
Projected benefit obligations, beginning of year ..................... 1,999,947 1,688,701
Service cost ................................................. 29,223 24,163
Interest cost ................................................. 77,620 81,496
Participant contributions ....................................... 3,483 3,429
Actuarial (gain) loss .......................................... (101,387) 306,797
Benefits paid ................................................ (87,994) (88,746)
Plan amendments ............................................. (1,510) 263
Currency translation .......................................... (7,367) (16,156)
Projected benefit obligations, end of year .......................... 1,912,015 1,999,947
Funded status, end of year ...................................... $ (156,641) $ (371,693)
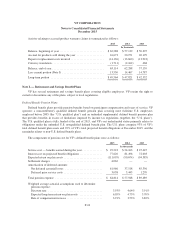
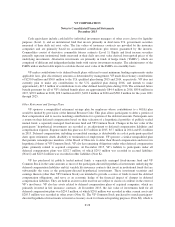
Pension benefits are reported in the balance sheet as a net asset or liability based on the overfunded or
underfunded status of the defined benefit plans, assessed on a plan-by-plan basis.
2015 2014
In thousands
Amounts included in Consolidated Balance Sheets:
Noncurrent assets (Note G) ..................................... $ 9,273 $ 1,491
Current liabilities (Note I) ...................................... (8,480) (8,880)
Noncurrent liabilities (Note K) .................................. (157,434) (364,304)
Funded status ................................................ $ (156,641) $ (371,693)
Accumulated other comprehensive (income) loss, pretax:
Net deferred actuarial losses .................................. $ 586,828 $ 588,847
Deferred prior service costs .................................. 17,459 21,950
Total accumulated other comprehensive (income) loss, pretax ....... $ 604,287 $ 610,797
Accumulated benefit obligations ................................. $1,827,521 $1,916,070
Weighted average actuarial assumptions used to determine pension
obligations:
Discount rate ................................................ 4.29% 3.47%
Rate of compensation increase .................................. 3.90% 3.34%
F-25