North Face 2015 Annual Report Download - page 40
Download and view the complete annual report
Please find page 40 of the 2015 North Face annual report below. You can navigate through the pages in the report by either clicking on the pages listed below, or by using the keyword search tool below to find specific information within the annual report.-
 1
1 -
2
-
3
-
4
-
5
-
6
-
7
-
8
-
9
-
10
-
11
-
12
-
13
-
14
-
15
-
16
-
17
-
18
-
19
-
20
-
21
-
22
-
23
-
24
-
25
-
26
-
27
-
28
-
29
-
 30
30 -
 31
31 -
 32
32 -
 33
33 -
 34
34 -
 35
35 -
 36
36 -
 37
37 -
 38
38 -
 39
39 -
 40
40 -
 41
41 -
 42
42 -
 43
43 -
 44
44 -
 45
45 -
 46
46 -
 47
47 -
 48
48 -
 49
49 -
 50
50 -
51
-
52
-
53
-
54
-
55
-
56
-
57
-
58
-
59
-
60
-
61
-
62
-
63
-
64
-
65
-
66
-
67
-
68
-
69
-
70
-
71
-
72
-
73
-
74
-
75
-
76
-
77
-
78
-
79
-
80
-
81
-
82
-
83
-
84
-
85
-
86
-
87
-
88
-
89
-
90
-
91
-
92
-
93
-
94
-
95
-
96
-
97
-
98
-
99
-
100
-
101
-
102
-
103
-
104
-
105
-
106
-
107
-
108
-
109
-
110
-
111
-
112
-
113
-
114
-
115
-
116
-
117
-
118
-
119
-
120
-
121
-
122
-
123
-
124
-
125
-
126
-
127
-
128
-
129
-
130
 |
 |

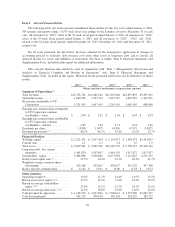
Item 6. Selected Financial Data.
The following table sets forth selected consolidated financial data for the five years ended January 2, 2016.
VF operates and reports using a 52/53 week fiscal year ending on the Saturday closest to December 31 of each
year. All references to “2015” relate to the 52-week fiscal period ended January 2, 2016, all references to “2014”
relate to the 53-week fiscal period ended January 3, 2015, and all references to “2013”, “2012” and “2011”
related to the 52-week fiscal periods ended December 28, 2013, December 29, 2012 and December 31, 2011,
respectively.
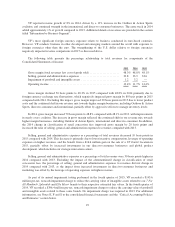
For all years presented, the data below has been adjusted for the retrospective application of changes in
accounting policies to reclassify debt issuance costs from other assets to long-term debt, and to classify all
deferred income tax assets and liabilities as noncurrent. See Note A within “Item 8. Financial Statements and
Supplementary Data” included in this report for additional information.
This selected financial data should be read in conjunction with “Item 7. Management’s Discussion and
Analysis of Financial Condition and Results of Operations” and “Item 8. Financial Statements and
Supplementary Data” included in this report. Historical results presented herein may not be indicative of future
results.
2015 (9) 2014 (9) 2013 (9) 2012 (9) 2011 (9)
Dollars and shares in thousands, except per share amounts
Summary of Operations (1)
Total revenues .................... $12,376,744 $12,282,161 $11,419,648 $10,879,855 $9,459,232
Operating income ................. 1,660,996 1,437,724 1,647,147 1,465,267 1,244,791
Net income attributable to VF
Corporation .................... 1,231,593 1,047,505 1,210,119 1,085,999 888,089
Earnings per common share attributable
to VF Corporation common
stockholders – basic ............. $ 2.90 $ 2.42 $ 2.76 $ 2.47 $ 2.03
Earnings per common share attributable
to VF Corporation common
stockholders – diluted ............ 2.85 2.38 2.71 2.43 2.00
Dividends per share ................ 1.3300 1.1075 0.9150 0.7575 0.6525
Dividend payout ratio (2) ............ 46.7% 46.5% 33.8% 31.2% 32.7%
Financial Position
Working capital ................... $ 2,221,423 $ 2,417,504 $ 2,155,027 $ 1,583,457 $1,424,935
Current ratio ..................... 2.1 2.5 2.4 1.9 1.9
Total assets ...................... $ 9,639,542 $ 9,845,300 $10,169,279 $ 9,509,319 $9,208,122
Long-term debt, less current
maturities ...................... 1,401,820 1,413,847 1,416,191 1,417,027 1,817,837
Stockholders’ equity ............... 5,384,838 5,630,882 6,077,038 5,125,625 4,525,175
Debt to total capital ratio (3) .......... 25.7% 20.4% 19.2% 26.3% 31.7%
Weighted average common shares
outstanding .................... 425,408 432,611 438,657 439,292 437,148
Book value per common share ....... $ 12.62 $ 13.01 $ 13.80 $ 11.63 $ 10.23
Other Statistics
Operating margin (4) ................ 13.4% 11.7% 14.4% 13.5% 13.2%
Return on invested capital (5) (6) ....... 17.2% 14.6% 17.6% 16.3% 15.9%
Return on average stockholders’
equity (5)(7) ..................... 25.6% 19.2% 23.7% 24.7% 22.0%
Return on average total assets (5)(8) .... 12.9% 10.8% 13.0% 12.0% 12.0%
Cash provided by operations ......... $ 1,146,510 $ 1,697,629 $ 1,506,041 $ 1,275,000 $1,081,371
Cash dividends paid ............... 565,275 478,933 402,136 333,229 285,722
26