North Face 2015 Annual Report Download - page 46
Download and view the complete annual report
Please find page 46 of the 2015 North Face annual report below. You can navigate through the pages in the report by either clicking on the pages listed below, or by using the keyword search tool below to find specific information within the annual report.
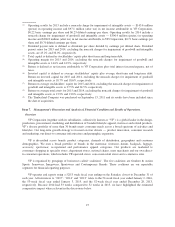
The Outdoor & Action Sports coalition includes the following brands: The North Face®,Vans®,
Timberland®,Kipling®(outside of North America), Napapijri®,JanSport®, Reef®,SmartWool®, Eastpak®,lucy®
and Eagle Creek®.
Global revenues for Outdoor & Action Sports increased 3% in 2015, reflecting 9% operational growth
despite the warmer weather in the fourth quarter and the softer retail environment compared with 2014. The
operational growth was partially offset by a negative 6% impact from foreign currency. The 53rd week in 2014
also negatively impacted 2015 revenue growth. Revenues in the Americas region increased 8% in 2015,
including a 2% negative impact from foreign currency. Revenues in the Asia Pacific region increased 10% in
2015 despite a 5% negative impact from foreign currency. European revenues declined 10% in 2015, including a
16% negative impact from foreign currency.
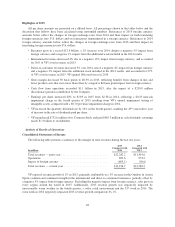
Global revenues for The North Face®brand increased 1% in 2015 over 2014, as operational growth in the
direct-to-consumer channel was partially offset by a negative 4% impact from foreign currency. Sales for The
North Face®brand were negatively impacted by the warm weather in 2015, particularly during the fourth quarter
when consumer demand for cold-weather products is typically at its peak. Vans®brand global revenues were up
7% in 2015, reflecting operational growth in both the direct-to-consumer and wholesale channels, partially offset
by a negative 7% impact from foreign currency. Global revenues for the Timberland®brand were up 2% in 2015
driven by strong wholesale revenues, partially offset by a negative 8% impact from foreign currency and reduced
consumer demand for outdoor apparel and footwear as a result of the warm weather noted above.
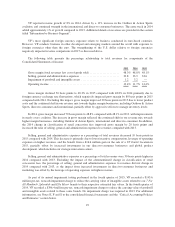
Global direct-to-consumer revenues for Outdoor & Action Sports grew 6% in 2015 over 2014, driven by
new store openings and an expanding e-commerce business. Foreign currency negatively impacted direct-to-
consumer revenues by 5% in 2015. Wholesale revenues were up 1% in 2015, including an 8% negative impact
from foreign currency.
The Outdoor & Action Sports coalition revenues increased 13% in 2014 over 2013 primarily due to growth
in The North Face®, Vans®and Timberland®brands, which achieved global revenue growth of 11%, 17% and
13%, respectively. Revenues in the Americas, European and Asia Pacific regions increased 14%, 9% and 17%,
respectively. Direct-to-consumer revenues rose 22% in 2014 driven by increases of 31% and 24% for The North
Face®and Vans®brands, respectively. New store openings and comparable sales growth, which includes an
expanding e-commerce business, all contributed to the direct-to-consumer revenue growth.
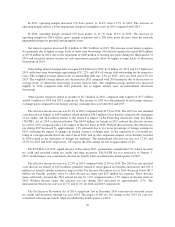
Operating margin decreased 110 basis points in 2015 due to the negative impact from foreign currency and
increased investments in direct-to-consumer businesses, partially offset by the leverage of operating expenses on
higher revenues.
Operating margin increased 90 basis points in 2014 driven by a shift in business mix towards higher margin
businesses and the leverage of operating expenses on higher revenues, partially offset by increased investments
in direct-to-consumer businesses and marketing.
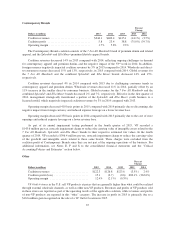
Jeanswear
Percent
Change
Dollars in millions 2015 2014 2013 2015 2014
Coalition revenues ......................... $2,792.2 $2,801.8 $2,811.0 (0.3%) (0.3%)
Coalition profit ............................ 535.4 528.0 544.9 1.4% (3.1%)
Operating margin .......................... 19.2% 18.8% 19.4%
The Jeanswear coalition consists of the global jeanswear businesses, led by the Wrangler®and Lee®brands.
32


