North Face 2015 Annual Report Download - page 6
Download and view the complete annual report
Please find page 6 of the 2015 North Face annual report below. You can navigate through the pages in the report by either clicking on the pages listed below, or by using the keyword search tool below to find specific information within the annual report.-
 1
1 -
 2
2 -
 3
3 -
 4
4 -
 5
5 -
 6
6 -
 7
7 -
 8
8 -
 9
9 -
 10
10 -
 11
11 -
 12
12 -
 13
13 -
 14
14 -
 15
15 -
 16
16 -
 17
17 -
18
-
19
-
20
-
21
-
22
-
23
-
24
-
25
-
26
-
27
-
28
-
29
-
30
-
31
-
32
-
33
-
34
-
35
-
36
-
37
-
38
-
39
-
40
-
41
-
42
-
43
-
44
-
45
-
46
-
47
-
48
-
49
-
50
-
51
-
52
-
53
-
54
-
55
-
56
-
57
-
58
-
59
-
60
-
61
-
62
-
63
-
64
-
65
-
66
-
67
-
68
-
69
-
70
-
71
-
72
-
73
-
74
-
75
-
76
-
77
-
78
-
79
-
80
-
81
-
82
-
83
-
84
-
85
-
86
-
87
-
88
-
89
-
90
-
91
-
92
-
93
-
94
-
95
-
96
-
97
-
98
-
99
-
100
-
101
-
102
-
103
-
104
-
105
-
106
-
107
-
108
-
109
-
110
-
111
-
112
-
113
-
114
-
115
-
116
-
117
-
118
-
119
-
120
-
121
-
122
-
123
-
124
-
125
-
126
-
127
-
128
-
129
-
130
 |
 |

1See discussion of currency-neutral amounts on Page 28 of the 2015 Annual Report on Form 10-K.
2Earnings per share in 2015 is adjusted to exclude impairment charges for intangible assets. GAAP earnings per share for the year was
$2.85. Earnings per share in 2014 was adjusted to exclude impairment charges for goodwill and intangible assets. GAAP earnings per share
for the year was $2.38.
04
The program has four objectives: 1) Maintain safe and healthy
environments for all workers; 2) Manufacture products and source
raw materials responsibly and ethically; 3) Reduce the environmental
impact of our business; and 4) Improve the standard of living for all
workers who make our products. In its earliest stages, this effort is
already beginning to make a difference.
As we move forward, I remain confident in our future, just as I am
grateful to you, our shareholders, for your continued confidence …
to our customers and consumers worldwide for their loyalty … and
to our 64,000 associates whose passion and commitment enable
our achievements.
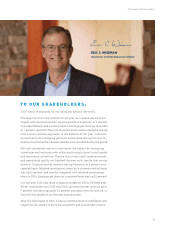
Eric C. Wiseman
Chairman & Chief Executive Officer
March 11, 2016
(DILUTED) (BILLIONS)
(DI
L
UTED
)
(
BILL
IO
N
S
)
REVENUES
(BILLIONS)
ANNUAL EARNINGS
PER SHARE2
ANNUAL DIVIDENDS
PER SHARE
CASH FLOW
FROM OPERATIONS
2011 2012 2013 2014 2015 2011 2012 2013 2014 2015 2011 2012 2013 2014 2015 2011 2012 2013 2014 2015
$12.4
$12.3
$11.4
$10.9
$9.5
$3.08$3.08
$2.71
$2.43
$2.00
$1.33
$1.11
$0.92
$0.76
$0.65
$1.1
$1.7
$1.5
$1.3
$1.1