North Face 2015 Annual Report Download - page 45
Download and view the complete annual report
Please find page 45 of the 2015 North Face annual report below. You can navigate through the pages in the report by either clicking on the pages listed below, or by using the keyword search tool below to find specific information within the annual report.-
 1
1 -
2
-
3
-
4
-
5
-
6
-
7
-
8
-
9
-
10
-
11
-
12
-
13
-
14
-
15
-
16
-
17
-
18
-
19
-
20
-
21
-
22
-
23
-
24
-
25
-
26
-
27
-
28
-
29
-
30
-
31
-
32
-
33
-
34
-
 35
35 -
 36
36 -
 37
37 -
 38
38 -
 39
39 -
 40
40 -
 41
41 -
 42
42 -
 43
43 -
 44
44 -
 45
45 -
 46
46 -
 47
47 -
 48
48 -
 49
49 -
 50
50 -
 51
51 -
 52
52 -
 53
53 -
 54
54 -
 55
55 -
56
-
57
-
58
-
59
-
60
-
61
-
62
-
63
-
64
-
65
-
66
-
67
-
68
-
69
-
70
-
71
-
72
-
73
-
74
-
75
-
76
-
77
-
78
-
79
-
80
-
81
-
82
-
83
-
84
-
85
-
86
-
87
-
88
-
89
-
90
-
91
-
92
-
93
-
94
-
95
-
96
-
97
-
98
-
99
-
100
-
101
-
102
-
103
-
104
-
105
-
106
-
107
-
108
-
109
-
110
-
111
-
112
-
113
-
114
-
115
-
116
-
117
-
118
-
119
-
120
-
121
-
122
-
123
-
124
-
125
-
126
-
127
-
128
-
129
-
130
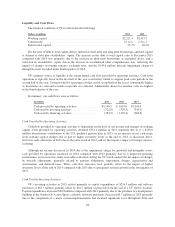
 |
 |

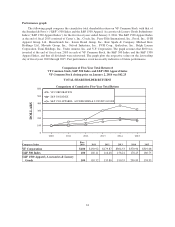
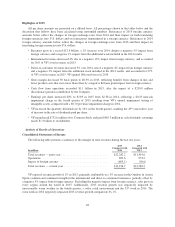
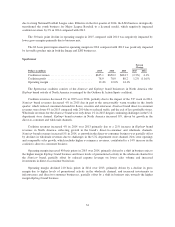
As a result of the above, net income in 2015 increased to $1.2 billion ($2.85 per share), compared with $1.0
billion ($2.38 per share) in 2014 and $1.2 billion ($2.71 per share) in 2013. The increase in earnings per share in
2015 compared with 2014 reflects the lower intangible asset impairment charge ($0.23 per share in 2015
compared with $0.70 per share in 2014) and improved operating performance, partially offset by the negative
impact from foreign currency. The decrease in earnings per share in 2014 compared with 2013 reflects the
goodwill and intangible asset impairment charge in 2014, partially offset by improved operating performance.
Refer to additional discussion in the “Information by Business Segment” section below.
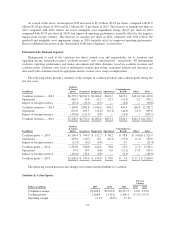
Information by Business Segment
Management at each of the coalitions has direct control over and responsibility for its revenues and
operating income, hereinafter termed “coalition revenues” and “coalition profit”, respectively. VF management
evaluates operating performance and makes investment and other decisions based on coalition revenues and
coalition profit. Common costs such as information systems processing, retirement benefits and insurance are
allocated to the coalitions based on appropriate metrics such as sales, usage or employment.
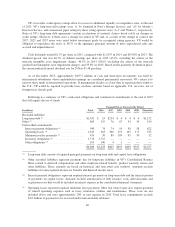
The following tables present a summary of the changes in coalition revenues and coalition profit during the
last two years:
In millions
Outdoor
& Action
Sports Jeanswear Imagewear Sportswear
Contemporary
Brands Other Total
Coalition revenues — 2013 ........ $6,379.2 $2,811.0 $1,066.0 $624.7 $415.1 $123.6 $11,419.6
Operations ...................... 862.9 33.8 42.3 25.5 (14.5) 3.2 953.2
Impact of foreign currency ......... (43.1) (43.0) (4.3) — (0.2) — (90.6)
Coalition revenues — 2014 ........ 7,199.0 2,801.8 1,104.0 650.2 400.4 126.8 12,282.2
Operations ...................... 672.0 101.7 (11.6) (15.1) (42.9) (4.5) 699.6
Impact of foreign currency ......... (470.6) (111.3) (9.8) — (13.4) — (605.1)
Coalition revenues — 2015 ........ $7,400.4 $2,792.2 $1,082.6 $635.1 $344.1 $122.3 $12,376.7
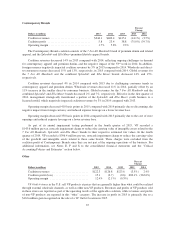
In millions
Outdoor
& Action
Sports Jeanswear Imagewear Sportswear
Contemporary
Brands Other Total
Coalition profit — 2013 ........... $1,106.4 $ 544.9 $ 152.2 $ 88.2 $ 38.8 $ (0.6) $ 1,929.9
Operations ...................... 219.0 (16.7) 13.1 (10.2) (15.5) (2.1) 187.6
Impact of foreign currency ......... (12.4) (0.2) (0.9) — 0.1 — (13.4)
Coalition profit — 2014 ........... 1,313.0 528.0 164.4 78.0 23.4 (2.7) 2,104.1
Operations ...................... 97.4 39.5 (0.6) 0.9 (15.1) 17.8 139.9
Impact of foreign currency ......... (143.6) (32.1) (5.8) — (2.5) — (184.0)
Coalition profit — 2015 ........... $1,266.8 $ 535.4 $ 158.0 $ 78.9 $ 5.8 $ 15.1 $ 2,060.0
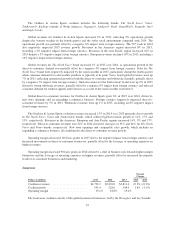
The following section discusses the changes in revenues and profitability by coalition:
Outdoor & Action Sports
Percent
Change
Dollars in millions 2015 2014 2013 2015 2014
Coalition revenues ......................... $7,400.4 $7,199.0 $6,379.2 2.8% 12.9%
Coalition profit ............................ 1,266.8 1,313.0 1,106.4 (3.5%) 18.7%
Operating margin .......................... 17.1% 18.2% 17.3%
31