North Face 2015 Annual Report Download - page 42
Download and view the complete annual report
Please find page 42 of the 2015 North Face annual report below. You can navigate through the pages in the report by either clicking on the pages listed below, or by using the keyword search tool below to find specific information within the annual report.-
 1
1 -
2
-
3
-
4
-
5
-
6
-
7
-
8
-
9
-
10
-
11
-
12
-
13
-
14
-
15
-
16
-
17
-
18
-
19
-
20
-
21
-
22
-
23
-
24
-
25
-
26
-
27
-
28
-
29
-
30
-
31
-
 32
32 -
 33
33 -
 34
34 -
 35
35 -
 36
36 -
 37
37 -
 38
38 -
 39
39 -
 40
40 -
 41
41 -
 42
42 -
 43
43 -
 44
44 -
 45
45 -
 46
46 -
 47
47 -
 48
48 -
 49
49 -
 50
50 -
 51
51 -
 52
52 -
53
-
54
-
55
-
56
-
57
-
58
-
59
-
60
-
61
-
62
-
63
-
64
-
65
-
66
-
67
-
68
-
69
-
70
-
71
-
72
-
73
-
74
-
75
-
76
-
77
-
78
-
79
-
80
-
81
-
82
-
83
-
84
-
85
-
86
-
87
-
88
-
89
-
90
-
91
-
92
-
93
-
94
-
95
-
96
-
97
-
98
-
99
-
100
-
101
-
102
-
103
-
104
-
105
-
106
-
107
-
108
-
109
-
110
-
111
-
112
-
113
-
114
-
115
-
116
-
117
-
118
-
119
-
120
-
121
-
122
-
123
-
124
-
125
-
126
-
127
-
128
-
129
-
130
 |
 |

Highlights of 2015
All per share amounts are presented on a diluted basis. All percentages shown in the tables below and the
discussion that follows have been calculated using unrounded numbers. References to 2015 foreign currency
amounts below reflect the changes in foreign exchange rates from 2014 and their impact on both translating
foreign currencies into U.S. dollars and on transactions denominated in a foreign currency. References to 2014
foreign currency amounts below reflect the changes in foreign exchange rates from 2013 and their impact on
translating foreign currencies into U.S. dollars.
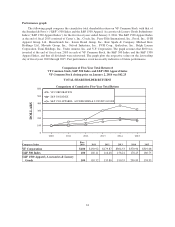
• Revenues grew to a record $12.4 billion, a 1% increase over 2014, despite a negative 5% impact from
foreign currency and a negative 1% impact from the additional week included in the 2014 results.
• International revenues decreased 4% due to a negative 13% impact from foreign currency, and accounted
for 36% of VF’s total revenues in 2015.
• Direct-to-consumer revenues increased 3% over 2014, net of a negative 4% impact from foreign currency
and a negative 3% impact from the additional week included in the 2014 results, and accounted for 27%
of VF’s total revenues in 2015. VF opened 186 retail stores in 2015.
• Gross margin decreased 50 basis points to 48.3% in 2015, reflecting benefits from changes in mix and
lower product costs that were more than offset by a negative 80 basis point impact from foreign currency.
• Cash flow from operations exceeded $1.1 billion in 2015, after the impact of a $250.0 million
discretionary pension contribution by the Company.
• Earnings per share increased 20% to $2.85 in 2015 from $2.38 in 2014, reflecting a $0.23 noncash
impairment charge in the fourth quarter of 2015 resulting from VF’s annual impairment testing of
intangible assets, compared with a $0.70 per share impairment charge in 2014.
• VF increased the quarterly dividend rate by 16% in the fourth quarter, marking the 43rd consecutive year
of increase in the rate of dividends paid per share.
• VF repurchased $732.6 million of its Common Stock and paid $565.3 million in cash dividends, returning
nearly $1.3 billion to stockholders.
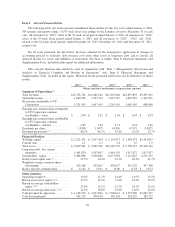
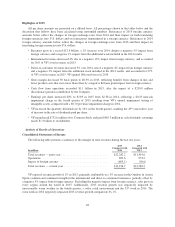
Analysis of Results of Operations
Consolidated Statements of Income
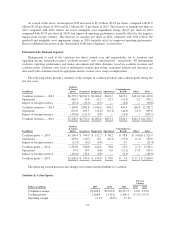
The following table presents a summary of the changes in total revenues during the last two years:
In millions
2015
Compared with
2014
2014
Compared with
2013
Total revenues — prior year ................................. $12,282.2 $11,419.6
Operations .............................................. 699.6 953.2
Impact of foreign currency .................................. (605.1) (90.6)
Total revenues — current year ............................... $12,376.7 $12,282.2
VF reported revenue growth of 1% in 2015, primarily attributable to a 3% increase in the Outdoor & Action
Sports coalition and continued strength in the international and direct-to-consumer businesses, partially offset by
a negative 5% impact from foreign currency. Excluding the negative impact from foreign currency, sales grew in
every region around the world in 2015. Additionally, 2015 revenue growth was negatively impacted by
unseasonably warm weather in the fourth quarter, a softer retail environment and the 53rd week in 2014. The
extra week in 2014 negatively impacted 2015 revenue growth comparisons by 1%.
28