North Face 2015 Annual Report Download - page 86
Download and view the complete annual report
Please find page 86 of the 2015 North Face annual report below. You can navigate through the pages in the report by either clicking on the pages listed below, or by using the keyword search tool below to find specific information within the annual report.-
 1
1 -
2
-
3
-
4
-
5
-
6
-
7
-
8
-
9
-
10
-
11
-
12
-
13
-
14
-
15
-
16
-
17
-
18
-
19
-
20
-
21
-
22
-
23
-
24
-
25
-
26
-
27
-
28
-
29
-
30
-
31
-
32
-
33
-
34
-
35
-
36
-
37
-
38
-
39
-
40
-
41
-
42
-
43
-
44
-
45
-
46
-
47
-
48
-
49
-
50
-
51
-
52
-
53
-
54
-
55
-
56
-
57
-
58
-
59
-
60
-
61
-
62
-
63
-
64
-
65
-
66
-
67
-
68
-
69
-
70
-
71
-
72
-
73
-
74
-
75
-
 76
76 -
 77
77 -
 78
78 -
 79
79 -
 80
80 -
 81
81 -
 82
82 -
 83
83 -
 84
84 -
 85
85 -
 86
86 -
 87
87 -
 88
88 -
 89
89 -
 90
90 -
 91
91 -
 92
92 -
 93
93 -
 94
94 -
 95
95 -
 96
96 -
97
-
98
-
99
-
100
-
101
-
102
-
103
-
104
-
105
-
106
-
107
-
108
-
109
-
110
-
111
-
112
-
113
-
114
-
115
-
116
-
117
-
118
-
119
-
120
-
121
-
122
-
123
-
124
-
125
-
126
-
127
-
128
-
129
-
130
 |
 |
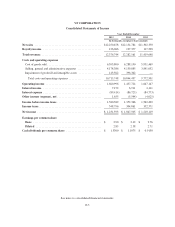
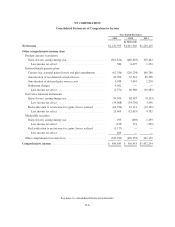
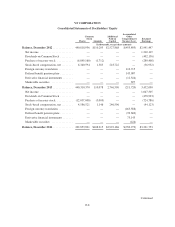
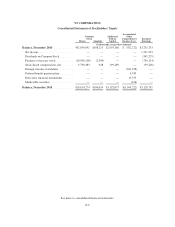
VF CORPORATION
Notes to Consolidated Financial Statements
December 2015
Note A — Summary of Significant Accounting Policies
Description of Business
VF Corporation (together with its subsidiaries, collectively known as “VF”) is a global apparel and footwear
company based in the United States. VF designs, produces, procures, markets and distributes a variety of
products, including jeanswear, outerwear, footwear, backpacks, luggage, sportswear, and occupational and
performance apparel, for consumers of all ages. Products are marketed primarily under VF-owned brand names.
Basis of Presentation
The consolidated financial statements and related disclosures are presented in accordance with generally
accepted accounting principles in the U.S (“GAAP”). The consolidated financial statements include the accounts
of VF and its controlled subsidiaries, after elimination of intercompany transactions and balances.
Fiscal Year
VF operates and reports using a 52/53 week fiscal year ending on the Saturday closest to December 31 of
each year. All references to “2015”, “2014” and “2013” relate to the 52-week fiscal year ended January 2, 2016,
the 53-week fiscal year ended January 3, 2015, and the 52-week fiscal year ended December 28, 2013,
respectively. Certain foreign subsidiaries report using a December 31 year-end due to local statutory
requirements.
Use of Estimates
In preparing the consolidated financial statements in accordance with GAAP, management makes estimates
and assumptions that affect amounts reported in the consolidated financial statements and accompanying notes.
Actual results may differ from those estimates.
Foreign Currency Translation and Transaction
The financial statements of most foreign subsidiaries are measured using the foreign currency as the
functional currency. Assets and liabilities denominated in a foreign currency are translated into U.S. dollars using
exchange rates in effect at the balance sheet date, and revenues and expenses are translated at average exchange
rates during the period. Resulting translation gains and losses, and transaction gains and losses on long-term
advances to foreign subsidiaries, are reported in other comprehensive income (loss) (“OCI”).
Foreign currency transactions are denominated in a currency other than the functional currency of a
particular entity. These transactions generally result in receivables or payables that are fixed in the foreign
currency. Transaction gains or losses arise when exchange rate fluctuations either increase or decrease the
functional currency cash flows from the originally recorded transaction. As discussed in Note T, VF enters into
derivative contracts to manage foreign currency risk on certain of these transactions. Foreign currency
transaction gains and losses reported in the Consolidated Statements of Income, net of the related hedging
impact, were a loss of $9.0 million in 2015, a gain of $6.1 million in 2014, and a gain of $9.1 million in 2013.
Cash and Equivalents
Cash and equivalents are demand deposits, receivables from third-party credit card processors, and highly
liquid investments that mature within three months of their purchase dates. Cash equivalents totaling $535.1
million and $585.9 million at December 2015 and 2014, respectively, consist of money market funds and short-
term time deposits.
F-10