Logitech 2012 Annual Report Download - page 267
Download and view the complete annual report
Please find page 267 of the 2012 Logitech annual report below. You can navigate through the pages in the report by either clicking on the pages listed below, or by using the keyword search tool below to find specific information within the annual report.-
 1
1 -
2
-
3
-
4
-
5
-
6
-
7
-
8
-
9
-
10
-
11
-
12
-
13
-
14
-
15
-
16
-
17
-
18
-
19
-
20
-
21
-
22
-
23
-
24
-
25
-
26
-
27
-
28
-
29
-
30
-
31
-
32
-
33
-
34
-
35
-
36
-
37
-
38
-
39
-
40
-
41
-
42
-
43
-
44
-
45
-
46
-
47
-
48
-
49
-
50
-
51
-
52
-
53
-
54
-
55
-
56
-
57
-
58
-
59
-
60
-
61
-
62
-
63
-
64
-
65
-
66
-
67
-
68
-
69
-
70
-
71
-
72
-
73
-
74
-
75
-
76
-
77
-
78
-
79
-
80
-
81
-
82
-
83
-
84
-
85
-
86
-
87
-
88
-
89
-
90
-
91
-
92
-
93
-
94
-
95
-
96
-
97
-
98
-
99
-
100
-
101
-
102
-
103
-
104
-
105
-
106
-
107
-
108
-
109
-
110
-
111
-
112
-
113
-
114
-
115
-
116
-
117
-
118
-
119
-
120
-
121
-
122
-
123
-
124
-
125
-
126
-
127
-
128
-
129
-
130
-
131
-
132
-
133
-
134
-
135
-
136
-
137
-
138
-
139
-
140
-
141
-
142
-
143
-
144
-
145
-
146
-
147
-
148
-
149
-
150
-
151
-
152
-
153
-
154
-
155
-
156
-
157
-
158
-
159
-
160
-
161
-
162
-
163
-
164
-
165
-
166
-
167
-
168
-
169
-
170
-
171
-
172
-
173
-
174
-
175
-
176
-
177
-
178
-
179
-
180
-
181
-
182
-
183
-
184
-
185
-
186
-
187
-
188
-
189
-
190
-
191
-
192
-
193
-
194
-
195
-
196
-
197
-
198
-
199
-
200
-
201
-
202
-
203
-
204
-
205
-
206
-
207
-
208
-
209
-
210
-
211
-
212
-
213
-
214
-
215
-
216
-
217
-
218
-
219
-
220
-
221
-
222
-
223
-
224
-
225
-
226
-
227
-
228
-
229
-
230
-
231
-
232
-
233
-
234
-
235
-
236
-
237
-
238
-
239
-
240
-
241
-
242
-
243
-
244
-
245
-
246
-
247
-
248
-
249
-
250
-
251
-
252
-
253
-
254
-
255
-
256
-
 257
257 -
 258
258 -
 259
259 -
 260
260 -
 261
261 -
 262
262 -
 263
263 -
 264
264 -
 265
265 -
 266
266 -
 267
267 -
 268
268 -
 269
269 -
 270
270 -
 271
271 -
 272
272 -
 273
273 -
 274
274 -
 275
275 -
 276
276 -
 277
277 -
278
-
279
-
280
-
281
-
282
-
283
-
284
-
285
-
286
-
287
-
288
-
289
-
290
-
291
-
292
 |
 |

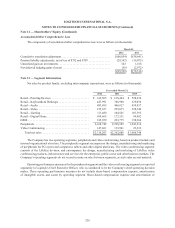
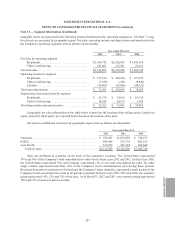
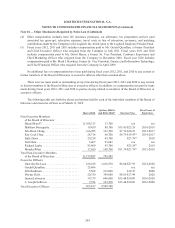
LOGITECH INTERNATIONAL S.A.
NOTES TO CONSOLIDATED FINANCIAL STATEMENTS (Continued)
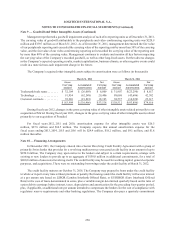
intangible assets are presented in the following financial information by operating segment as ‘‘all other.’’ Long-
lived assets are presented by geographic region. Net sales, operating income and depreciation and amortization for
the Company’s operating segments were as follows (in thousands):
Year ended March 31
2012 2011 2010
Net sales by operating segment
Peripherals.................................. $2,168,742 $2,228,985 $1,943,516
Video Conferencing .......................... 147,461 133,901 23,232
Total net sales.................................... $ 2,316,203 $2,362,886 $ 1,966,748
Operating income by segment
Peripherals.................................. $ 137,430 $ 204,202 $ 127,530
Video Conferencing .......................... (7,386) 1,100 (8,844)
All other ................................... (58,063) (62,646) (40,322)
Total operating income ............................ $ 71,981 $ 142,656 $ 78,364
Depreciation and amortization by segment
Peripherals.................................. $ 52,578 $ 55,816 $ 65,130
Video Conferencing .......................... 19,924 20,175 5,765
Total depreciation and amortization .................. $ 72,502 $ 75,991 $ 70,895
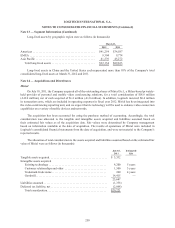
Geographic net sales information in the table below is based on the location of the selling entity. Long-lived
assets, primarily fixed assets, are reported below based on the location of the asset.
Net sales to unaffiliated customers by geographic region were as follows (in thousands):
Year ended March 31,
2012 2011 2010
Americas ........................................... $ 953,867 $1,032,988 $ 729,473
EMEA ............................................. 846,464 872,774 882,635
Asia Pacific ......................................... 515,872 457,124 354,640
Total net sales..................................... $2,316,203 $2,362,886 $1,966,748
Sales are attributed to countries on the basis of the customers’ locations. The United States represented
34% and 36% of the Company’s total consolidated net sales for the fiscal years 2012 and 2011. In fiscal year 2010,
the United States represented 32% and Germany represented 11% of our total consolidated net sales. No other
single country represented more than 10% of the Company’s total consolidated net sales during those periods.
Revenues from sales to customers in Switzerland, the Company’s home domicile, represented a small portion of the
Company’s total consolidated net sales in all periods presented. In fiscal years 2012, 2011 and 2010, one customer
group represented 14%, 12% and 13% of net sales. As of March 31, 2012 and 2011, one customer group represented
14% and 13% of total accounts receivable.
Note 13 — Segment Information (Continued)
ANNUAL REPORT
257