Logitech 2012 Annual Report Download - page 131
Download and view the complete annual report
Please find page 131 of the 2012 Logitech annual report below. You can navigate through the pages in the report by either clicking on the pages listed below, or by using the keyword search tool below to find specific information within the annual report.-
 1
1 -
2
-
3
-
4
-
5
-
6
-
7
-
8
-
9
-
10
-
11
-
12
-
13
-
14
-
15
-
16
-
17
-
18
-
19
-
20
-
21
-
22
-
23
-
24
-
25
-
26
-
27
-
28
-
29
-
30
-
31
-
32
-
33
-
34
-
35
-
36
-
37
-
38
-
39
-
40
-
41
-
42
-
43
-
44
-
45
-
46
-
47
-
48
-
49
-
50
-
51
-
52
-
53
-
54
-
55
-
56
-
57
-
58
-
59
-
60
-
61
-
62
-
63
-
64
-
65
-
66
-
67
-
68
-
69
-
70
-
71
-
72
-
73
-
74
-
75
-
76
-
77
-
78
-
79
-
80
-
81
-
82
-
83
-
84
-
85
-
86
-
87
-
88
-
89
-
90
-
91
-
92
-
93
-
94
-
95
-
96
-
97
-
98
-
99
-
100
-
101
-
102
-
103
-
104
-
105
-
106
-
107
-
108
-
109
-
110
-
111
-
112
-
113
-
114
-
115
-
116
-
117
-
118
-
119
-
120
-
 121
121 -
 122
122 -
 123
123 -
 124
124 -
 125
125 -
 126
126 -
 127
127 -
 128
128 -
 129
129 -
 130
130 -
 131
131 -
 132
132 -
 133
133 -
 134
134 -
 135
135 -
 136
136 -
 137
137 -
 138
138 -
 139
139 -
 140
140 -
 141
141 -
142
-
143
-
144
-
145
-
146
-
147
-
148
-
149
-
150
-
151
-
152
-
153
-
154
-
155
-
156
-
157
-
158
-
159
-
160
-
161
-
162
-
163
-
164
-
165
-
166
-
167
-
168
-
169
-
170
-
171
-
172
-
173
-
174
-
175
-
176
-
177
-
178
-
179
-
180
-
181
-
182
-
183
-
184
-
185
-
186
-
187
-
188
-
189
-
190
-
191
-
192
-
193
-
194
-
195
-
196
-
197
-
198
-
199
-
200
-
201
-
202
-
203
-
204
-
205
-
206
-
207
-
208
-
209
-
210
-
211
-
212
-
213
-
214
-
215
-
216
-
217
-
218
-
219
-
220
-
221
-
222
-
223
-
224
-
225
-
226
-
227
-
228
-
229
-
230
-
231
-
232
-
233
-
234
-
235
-
236
-
237
-
238
-
239
-
240
-
241
-
242
-
243
-
244
-
245
-
246
-
247
-
248
-
249
-
250
-
251
-
252
-
253
-
254
-
255
-
256
-
257
-
258
-
259
-
260
-
261
-
262
-
263
-
264
-
265
-
266
-
267
-
268
-
269
-
270
-
271
-
272
-
273
-
274
-
275
-
276
-
277
-
278
-
279
-
280
-
281
-
282
-
283
-
284
-
285
-
286
-
287
-
288
-
289
-
290
-
291
-
292
 |
 |

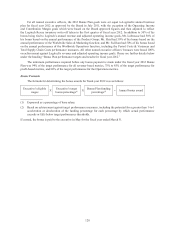
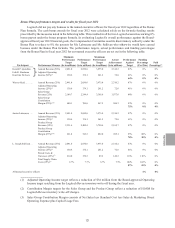
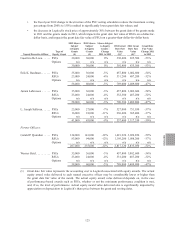
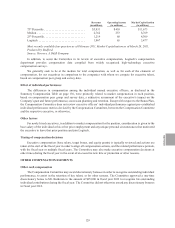
Bonus Plan performance targets and results for fiscal year 2012
Logitech did not pay any bonuses to the named executive officers for fiscal year 2012 regardless of the Bonus
Plan formula. The cash bonus awards for fiscal year 2012 were calculated solely on the formula funding results
prescribed by the measures noted in the following table. This resulted in all but two Logitech executives earning 0%
bonus payout under the bonus program formula. In evaluating Logitech’s overall performance against the Board-
approved fiscal year 2012 financial goals, the Compensation Committee used its discretionary authority under the
Bonus Plan to reduce to 0% the payouts for Mr. Labrousse and Mr. Sullivan who otherwise would have earned
bonuses under the Bonus Plan formula. The performance targets, actual performance and funding percentages
from the Bonus Plan in fiscal year 2012 for our named executive officers are set out in the following table:
Participant Performance Measure
Minimum
Performance
Target
($s in millions)
Performance
Target
($s in millions)
Maximum
Performance
Target
($s in millions)
Actual
Achievement
($s in millions)
Performance
Against
Target
Funding
Percentage
(Per Plan)
Paid
Percentage(7)
Gerald P. Quindlen . . Annual Revenue (50%) 2,491.0 2,650.0 3,975.0 2,316.2 87% 0% 0%
Erik K. Bardman
Guerrino De Luca
Adjusted Operating
Income (50%)(1) 130.6 174.1 261.2 72.0 41% 0% 0%
64% 0% 0%
Werner Heid . . . . . . . Annual Revenue (25%) 2,491.0 2,650.0 3,975.0 2,316.2 87% 0% 0%
Adjusted Operating
Income (25%)(1) 130.6 174.1 261.2 72.0 41% 0% 0%
Sales Group
Revenue (25%) 2,109.7 2,244.4 3,366.6 1,977.0 88% 0% 0%
Sales Group
Contribution
Margin (25%)(2) (3) 600.1 706.0 847.2 586.3 83% 0% 0%
75% 0% 0%
Junien Labrousse . . . Annual Revenue (25%) 2,491.0 2,650.0 3,975.0 2,316.2 87% 0% 0%
Adjusted Operating
Income (25%)(1) 130.6 174.1 261.2 72.0 41% 0% 0%
Product Group
Revenue (25%) 2,331.6 2,480.4 3,720.6 2,165.7 87% 0% 0%
Product Group
Contribution
Margin (25%)(2) (4) 631.8 743.3 892.0 705.1 95% 80% 0%
78% 20% 0%
L. Joseph Sullivan . . Annual Revenue (25%) 2,491.0 2,650.0 3,975.0 2,316.2 87% 0% 0%
Adjusted Operating
Income (25%)(1) 130.6 174.1 261.2 72.0 41% 0% 0%
Period Costs &
Variances (25%)(5) 214.0 178.3 89.2 149.2 116% 116% 0%
Total Supply Chain
Costs (25%)(6) 8.7% 7.7% 6.7% 7.5% 102% 102% 0%
87% 55% 0%
All named executive officers 4% 0%
(1) Adjusted Operating Income target reflects a reduction of $34 million from the Board-approved Operating
Income target resulting from the Logitech Revue inventory write-off during the fiscal year.
(2) Contribution Margin targets for the Sales Group and the Product Group reflect a reduction of $10.8M for
Logitech Revue inventory write-off charges.
(3) Sales Group Contribution Margin consists of Net Sales less Standard Cost less Sales & Marketing Direct
Operating Expense plus Capital Usage Fees.
ENGLISH
121