Logitech 2012 Annual Report Download - page 135
Download and view the complete annual report
Please find page 135 of the 2012 Logitech annual report below. You can navigate through the pages in the report by either clicking on the pages listed below, or by using the keyword search tool below to find specific information within the annual report.-
 1
1 -
2
-
3
-
4
-
5
-
6
-
7
-
8
-
9
-
10
-
11
-
12
-
13
-
14
-
15
-
16
-
17
-
18
-
19
-
20
-
21
-
22
-
23
-
24
-
25
-
26
-
27
-
28
-
29
-
30
-
31
-
32
-
33
-
34
-
35
-
36
-
37
-
38
-
39
-
40
-
41
-
42
-
43
-
44
-
45
-
46
-
47
-
48
-
49
-
50
-
51
-
52
-
53
-
54
-
55
-
56
-
57
-
58
-
59
-
60
-
61
-
62
-
63
-
64
-
65
-
66
-
67
-
68
-
69
-
70
-
71
-
72
-
73
-
74
-
75
-
76
-
77
-
78
-
79
-
80
-
81
-
82
-
83
-
84
-
85
-
86
-
87
-
88
-
89
-
90
-
91
-
92
-
93
-
94
-
95
-
96
-
97
-
98
-
99
-
100
-
101
-
102
-
103
-
104
-
105
-
106
-
107
-
108
-
109
-
110
-
111
-
112
-
113
-
114
-
115
-
116
-
117
-
118
-
119
-
120
-
121
-
122
-
123
-
124
-
 125
125 -
 126
126 -
 127
127 -
 128
128 -
 129
129 -
 130
130 -
 131
131 -
 132
132 -
 133
133 -
 134
134 -
 135
135 -
 136
136 -
 137
137 -
 138
138 -
 139
139 -
 140
140 -
 141
141 -
 142
142 -
 143
143 -
 144
144 -
 145
145 -
146
-
147
-
148
-
149
-
150
-
151
-
152
-
153
-
154
-
155
-
156
-
157
-
158
-
159
-
160
-
161
-
162
-
163
-
164
-
165
-
166
-
167
-
168
-
169
-
170
-
171
-
172
-
173
-
174
-
175
-
176
-
177
-
178
-
179
-
180
-
181
-
182
-
183
-
184
-
185
-
186
-
187
-
188
-
189
-
190
-
191
-
192
-
193
-
194
-
195
-
196
-
197
-
198
-
199
-
200
-
201
-
202
-
203
-
204
-
205
-
206
-
207
-
208
-
209
-
210
-
211
-
212
-
213
-
214
-
215
-
216
-
217
-
218
-
219
-
220
-
221
-
222
-
223
-
224
-
225
-
226
-
227
-
228
-
229
-
230
-
231
-
232
-
233
-
234
-
235
-
236
-
237
-
238
-
239
-
240
-
241
-
242
-
243
-
244
-
245
-
246
-
247
-
248
-
249
-
250
-
251
-
252
-
253
-
254
-
255
-
256
-
257
-
258
-
259
-
260
-
261
-
262
-
263
-
264
-
265
-
266
-
267
-
268
-
269
-
270
-
271
-
272
-
273
-
274
-
275
-
276
-
277
-
278
-
279
-
280
-
281
-
282
-
283
-
284
-
285
-
286
-
287
-
288
-
289
-
290
-
291
-
292
 |
 |

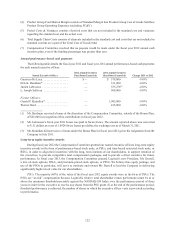
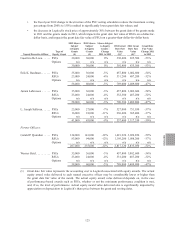
• the fiscal year 2012 change to the structure of the PSU vesting schedule to reduce the maximum vesting
percentage from 200% to 150% resulted in significantly lower grant date fair values; and
• the decrease in Logitech’s stock price of approximately 30% between the grant date of the grants made
in 2011 and the grants made in 2012, which impacts the grant date fair value of RSUs on a dollar-for-
dollar basis, and impacts the grant date fair value of PSUs on a greater-than-dollar-for-dollar basis.
Named Executive Officer
Type of
Equity Grant
2012 Shares
Subject
to Equity
Grants
(#)
2011 Shares
Subject
to Equity
Grants
(#)
Shares Subject
to Equity
Grants -
Change
2011 to 2012
2012 Grant
Date Fair
Value
($)(1)
2011 Grant
Date Fair
Value
($)(1)
Grant Date
Fair Value
Change 2011
to 2012
Guerrino De Luca ...... PSUs 30,000 30,000 0% 392,400 835,500 -53%
Options n/a n/a n/a n/a n/a n/a
30,000 30,000 0% 392,400 835,500 -53%
Erik K. Bardman. . . . . . . PSUs 35,000 36,000 -3% 457,800 1,002,600 -54%
RSUs 23,000 24,000 -4% 331,200 487,200 -32%
Options n/a n/a n/a n/a n/a n/a
58,000 60,000 -3% 789,000 1,489,800 -47%
Junien Labrousse . . . . . . PSUs 35,000 36,000 -3% 457,800 1,002,600 -54%
RSUs 23,000 24,000 -4% 332,580 487,200 -32%
Options n/a n/a n/a n/a n/a n/a
58,000 60,000 -3% 790,380 1,489,800 -47%
L. Joseph Sullivan ...... PSUs 25,000 27,000 -7% 327,000 751,950 -57%
RSUs 16,000 18,000 -11% 230,400 365,400 -37%
Options n/a n/a n/a n/a n/a n/a
41,000 45,000 -9% 557,400 1,117,350 -50%
Former Officers:
Gerald P. Quindlen . . . . . PSUs 124,000 141,000 -12% 1,621,920 3,926,850 -59%
RSUs 83,000 94,000 -12% 1,195,200 1,908,200 -37%
Options n/a n/a n/a n/a n/a n/a
207,000 235,000 -12% 2,817,120 5,835,050 -52%
Werner Heid . . . . . . . . . . PSUs 35,000 36,000 -3% 457,800 1,002,600 -54%
RSUs 23,000 24,000 -4% 331,200 487,200 -32%
Options n/a n/a n/a n/a n/a n/a
58,000 60,000 -3% 789,000 1,489,800 -47%
(1) Grant date fair value represents the accounting cost to Logitech associated with equity awards. The actual
equity award value delivered to each named executive officer may be considerably lower or higher than
the grant date fair value of the award. The actual equity award value delivered depends on, in the case
of performance-based awards such as PSUs, whether or not the minimum performance condition is met,
and, if so, the level of performance. Actual equity award value delivered also is significantly impacted by
appreciation or depreciation in Logitech’s share price between the grant and vesting dates.
ENGLISH
125