Logitech 2012 Annual Report Download - page 189
Download and view the complete annual report
Please find page 189 of the 2012 Logitech annual report below. You can navigate through the pages in the report by either clicking on the pages listed below, or by using the keyword search tool below to find specific information within the annual report.-
 1
1 -
2
-
3
-
4
-
5
-
6
-
7
-
8
-
9
-
10
-
11
-
12
-
13
-
14
-
15
-
16
-
17
-
18
-
19
-
20
-
21
-
22
-
23
-
24
-
25
-
26
-
27
-
28
-
29
-
30
-
31
-
32
-
33
-
34
-
35
-
36
-
37
-
38
-
39
-
40
-
41
-
42
-
43
-
44
-
45
-
46
-
47
-
48
-
49
-
50
-
51
-
52
-
53
-
54
-
55
-
56
-
57
-
58
-
59
-
60
-
61
-
62
-
63
-
64
-
65
-
66
-
67
-
68
-
69
-
70
-
71
-
72
-
73
-
74
-
75
-
76
-
77
-
78
-
79
-
80
-
81
-
82
-
83
-
84
-
85
-
86
-
87
-
88
-
89
-
90
-
91
-
92
-
93
-
94
-
95
-
96
-
97
-
98
-
99
-
100
-
101
-
102
-
103
-
104
-
105
-
106
-
107
-
108
-
109
-
110
-
111
-
112
-
113
-
114
-
115
-
116
-
117
-
118
-
119
-
120
-
121
-
122
-
123
-
124
-
125
-
126
-
127
-
128
-
129
-
130
-
131
-
132
-
133
-
134
-
135
-
136
-
137
-
138
-
139
-
140
-
141
-
142
-
143
-
144
-
145
-
146
-
147
-
148
-
149
-
150
-
151
-
152
-
153
-
154
-
155
-
156
-
157
-
158
-
159
-
160
-
161
-
162
-
163
-
164
-
165
-
166
-
167
-
168
-
169
-
170
-
171
-
172
-
173
-
174
-
175
-
176
-
177
-
178
-
 179
179 -
 180
180 -
 181
181 -
 182
182 -
 183
183 -
 184
184 -
 185
185 -
 186
186 -
 187
187 -
 188
188 -
 189
189 -
 190
190 -
 191
191 -
 192
192 -
 193
193 -
 194
194 -
 195
195 -
 196
196 -
 197
197 -
 198
198 -
 199
199 -
200
-
201
-
202
-
203
-
204
-
205
-
206
-
207
-
208
-
209
-
210
-
211
-
212
-
213
-
214
-
215
-
216
-
217
-
218
-
219
-
220
-
221
-
222
-
223
-
224
-
225
-
226
-
227
-
228
-
229
-
230
-
231
-
232
-
233
-
234
-
235
-
236
-
237
-
238
-
239
-
240
-
241
-
242
-
243
-
244
-
245
-
246
-
247
-
248
-
249
-
250
-
251
-
252
-
253
-
254
-
255
-
256
-
257
-
258
-
259
-
260
-
261
-
262
-
263
-
264
-
265
-
266
-
267
-
268
-
269
-
270
-
271
-
272
-
273
-
274
-
275
-
276
-
277
-
278
-
279
-
280
-
281
-
282
-
283
-
284
-
285
-
286
-
287
-
288
-
289
-
290
-
291
-
292
 |
 |

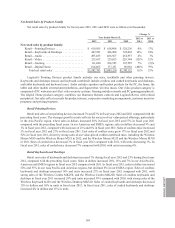
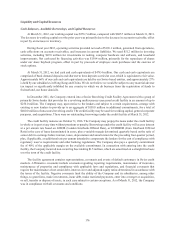
In fiscal year 2011, we sold our equity interest in certain 3Dconnexion subsidiaries and the related intellectual
property rights for $9.1 million, not including cash retained. The loss resulting from the sale was not material.
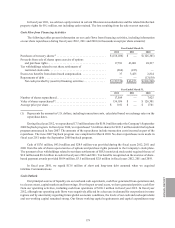
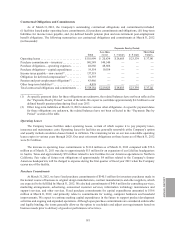
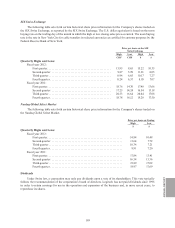
Cash Flow from Financing Activities
The following tables present information on our cash flows from financing activities, including information
on our share repurchases during fiscal years 2012, 2011 and 2010 (in thousands except per share amounts):
Year Ended March 31,
2012 2011 2010
Purchases of treasury shares(1) . . . . . . . . . . . . . . . . . . . . . . . . . . . . . . . . . . $ (156,036) $ — $ (126,301)
Proceeds from sale of shares upon exercise of options
and purchase rights . . . . . . . . . . . . . . . . . . . . . . . . . . . . . . . . . . . . . . . . 17,591 43,001 28,917
Tax withholdings related to net share settlements of
restricted stock units . . . . . . . . . . . . . . . . . . . . . . . . . . . . . . . . . . . . . . . (966)(223) —
Excess tax benefits from share-based compensation . . . . . . . . . . . . . . . . . 37 3,455 2,814
Repayments of debt . . . . . . . . . . . . . . . . . . . . . . . . . . . . . . . . . . . . . . . . . . — — (13,630)
Net cash provided by (used in) financing activities . . . . . . . . . . . . . . . $ (139,374) $46,233 $(108,200)
Year Ended March 31,
2012 2011 2010
Number of shares repurchased . . . . . . . . . . . . . . . . . . . . . . . . . . . . . . . . . . 17,509 —7,425
Value of shares repurchased(1) . . . . . . . . . . . . . . . . . . . . . . . . . . . . . . . . . . . 156,036 $ — $ 126,301
Average price per share . . . . . . . . . . . . . . . . . . . . . . . . . . . . . . . . . . . . . . . $ 8.91 $ — $ 17.01
(1) Represents the amount in U.S. dollars, including transaction costs, calculated based on exchange rates on the
repurchase dates.
During fiscal year 2012, we repurchased 17.5 million shares for $156.0 million under the Company’s September
2008 buyback program. In fiscal year 2010, we repurchased 7.4 million shares for $126.3 million under the buyback
program announced in June 2007. The amounts of the repurchases include transaction costs incurred as part of the
repurchase. The June 2007 buyback program was completed in March 2010. No share repurchases were made in
fiscal year 2011 under the September 2008 buyback program.
Cash of $17.6 million, $43.0 million and $28.9 million was provided during the fiscal years 2012, 2011 and
2010 from the sale of shares upon exercise of options and purchase rights pursuant to the Company’s stock plans.
The payment of tax withholdings related to net share settlements of RSUs (restricted stock units) required the use of
$1.0 million and $0.2 million in cash in fiscal years 2012 and 2011. Tax benefits recognized on the exercise of share-
based payment awards provided $0.04 million, $3.5 million and $2.8 million in fiscal years 2012, 2011 and 2010.
In fiscal year 2010, we repaid $13.6 million of short and long-term debt assumed when we acquired
LifeSize Communications.
Cash Outlook
Our principal sources of liquidity are our cash and cash equivalents, cash flow generated from operations and,
to a lesser extent, capital markets and borrowings. Over the past several years, we have generated positive cash flow
from our operating activities, including cash from operations of $196.1 million in fiscal year 2012. In fiscal year
2012, although our operating cash flows were negatively affected by a decrease in demand for our products in some
regions and by uncertainty regarding future global economic conditions, the levels of our cash and cash equivalents
and our working capital remained strong. Our future working capital requirements and capital expenditures may
ANNUAL REPORT
179