Logitech 2012 Annual Report Download - page 247
Download and view the complete annual report
Please find page 247 of the 2012 Logitech annual report below. You can navigate through the pages in the report by either clicking on the pages listed below, or by using the keyword search tool below to find specific information within the annual report.-
 1
1 -
2
-
3
-
4
-
5
-
6
-
7
-
8
-
9
-
10
-
11
-
12
-
13
-
14
-
15
-
16
-
17
-
18
-
19
-
20
-
21
-
22
-
23
-
24
-
25
-
26
-
27
-
28
-
29
-
30
-
31
-
32
-
33
-
34
-
35
-
36
-
37
-
38
-
39
-
40
-
41
-
42
-
43
-
44
-
45
-
46
-
47
-
48
-
49
-
50
-
51
-
52
-
53
-
54
-
55
-
56
-
57
-
58
-
59
-
60
-
61
-
62
-
63
-
64
-
65
-
66
-
67
-
68
-
69
-
70
-
71
-
72
-
73
-
74
-
75
-
76
-
77
-
78
-
79
-
80
-
81
-
82
-
83
-
84
-
85
-
86
-
87
-
88
-
89
-
90
-
91
-
92
-
93
-
94
-
95
-
96
-
97
-
98
-
99
-
100
-
101
-
102
-
103
-
104
-
105
-
106
-
107
-
108
-
109
-
110
-
111
-
112
-
113
-
114
-
115
-
116
-
117
-
118
-
119
-
120
-
121
-
122
-
123
-
124
-
125
-
126
-
127
-
128
-
129
-
130
-
131
-
132
-
133
-
134
-
135
-
136
-
137
-
138
-
139
-
140
-
141
-
142
-
143
-
144
-
145
-
146
-
147
-
148
-
149
-
150
-
151
-
152
-
153
-
154
-
155
-
156
-
157
-
158
-
159
-
160
-
161
-
162
-
163
-
164
-
165
-
166
-
167
-
168
-
169
-
170
-
171
-
172
-
173
-
174
-
175
-
176
-
177
-
178
-
179
-
180
-
181
-
182
-
183
-
184
-
185
-
186
-
187
-
188
-
189
-
190
-
191
-
192
-
193
-
194
-
195
-
196
-
197
-
198
-
199
-
200
-
201
-
202
-
203
-
204
-
205
-
206
-
207
-
208
-
209
-
210
-
211
-
212
-
213
-
214
-
215
-
216
-
217
-
218
-
219
-
220
-
221
-
222
-
223
-
224
-
225
-
226
-
227
-
228
-
229
-
230
-
231
-
232
-
233
-
234
-
235
-
236
-
 237
237 -
 238
238 -
 239
239 -
 240
240 -
 241
241 -
 242
242 -
 243
243 -
 244
244 -
 245
245 -
 246
246 -
 247
247 -
 248
248 -
 249
249 -
 250
250 -
 251
251 -
 252
252 -
 253
253 -
 254
254 -
 255
255 -
 256
256 -
 257
257 -
258
-
259
-
260
-
261
-
262
-
263
-
264
-
265
-
266
-
267
-
268
-
269
-
270
-
271
-
272
-
273
-
274
-
275
-
276
-
277
-
278
-
279
-
280
-
281
-
282
-
283
-
284
-
285
-
286
-
287
-
288
-
289
-
290
-
291
-
292
 |
 |

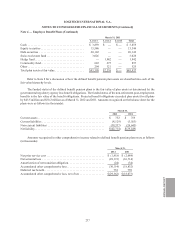
LOGITECH INTERNATIONAL S.A.
NOTES TO CONSOLIDATED FINANCIAL STATEMENTS (Continued)
March 31, 2011
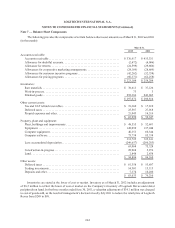
Level 1 Level 2 Level 3 Total
Cash ....................................... $ 3,859 $ — $— $ 3,859
Equity securities .............................. 15,546 — — 15,546
Debt securities . . . . . . . . . . . . . . . . . . . . . . . . . . . . . . . 20,142 — — 20,142
Swiss real estate fund .......................... 3,026 — — 3,026
Hedge fund .................................. — 1,942 — 1,942
Commodity fund. . . . . . . . . . . . . . . . . . . . . . . . . . . . . . 622 275 — 897
Other ....................................... 204 321 — 525
Total plan assets at fair value . . . . . . . . . . . . . . . . . . . . $43,399 $2,538 $ — $45,937
Refer to Note 8 for a discussion of how the defined benefit pension plan assets are classified into each of the
fair value hierarchy levels.
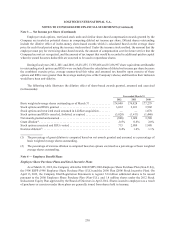
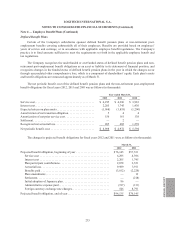
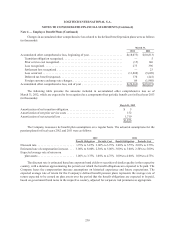
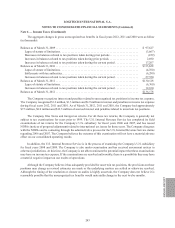
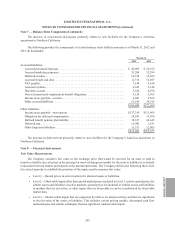
The funded status of the defined benefit pension plans is the fair value of plan assets as determined by the
governmental regulatory agency less benefit obligations. The funded status of the non-retirement post-employment
benefits is the fair value of the benefit obligations. Projected benefit obligations exceeded plan assets for all plans
by $43.5 million and $30.2 million as of March 31, 2012 and 2011. Amounts recognized on the balance sheet for the
plans were as follows (in thousands):
March 31,
2012 2011
Current assets .............................................. $ 752 $ 759
Current liabilities ........................................... (4,129) (3,563)
Non-current liabilities . . . . . . . . . . . . . . . . . . . . . . . . . . . . . . . . . . . . . . . (39,337) (26,645)
Net liability ................................................ $(42,714) $(29,449)
Amounts recognized in other comprehensive income related to defined benefit pension plans were as follows
(in thousands):
March 31,
2012 2011
Net prior service cost . . . . . . . . . . . . . . . . . . . . . . . . . . . . . . . . . . . . . . . . $ (1,918) $ (2,084)
Net actuarial loss ........................................... (28,172) (16,714)
Amortization of net transition obligation ......................... (24) (34)
Accumulated other comprehensive loss .......................... (30,114) (18,832)
Deferred tax benefit ......................................... 752 759
Accumulated other comprehensive loss, net of tax . . . . . . . . . . . . . . . . . $(29,362) $(18,073)
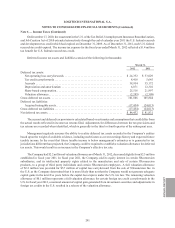
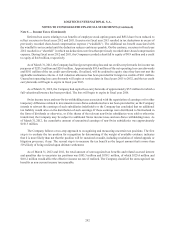
Note 4 — Employee Benefit Plans (Continued)
ANNUAL REPORT
237