Logitech 2012 Annual Report Download - page 151
Download and view the complete annual report
Please find page 151 of the 2012 Logitech annual report below. You can navigate through the pages in the report by either clicking on the pages listed below, or by using the keyword search tool below to find specific information within the annual report.-
 1
1 -
2
-
3
-
4
-
5
-
6
-
7
-
8
-
9
-
10
-
11
-
12
-
13
-
14
-
15
-
16
-
17
-
18
-
19
-
20
-
21
-
22
-
23
-
24
-
25
-
26
-
27
-
28
-
29
-
30
-
31
-
32
-
33
-
34
-
35
-
36
-
37
-
38
-
39
-
40
-
41
-
42
-
43
-
44
-
45
-
46
-
47
-
48
-
49
-
50
-
51
-
52
-
53
-
54
-
55
-
56
-
57
-
58
-
59
-
60
-
61
-
62
-
63
-
64
-
65
-
66
-
67
-
68
-
69
-
70
-
71
-
72
-
73
-
74
-
75
-
76
-
77
-
78
-
79
-
80
-
81
-
82
-
83
-
84
-
85
-
86
-
87
-
88
-
89
-
90
-
91
-
92
-
93
-
94
-
95
-
96
-
97
-
98
-
99
-
100
-
101
-
102
-
103
-
104
-
105
-
106
-
107
-
108
-
109
-
110
-
111
-
112
-
113
-
114
-
115
-
116
-
117
-
118
-
119
-
120
-
121
-
122
-
123
-
124
-
125
-
126
-
127
-
128
-
129
-
130
-
131
-
132
-
133
-
134
-
135
-
136
-
137
-
138
-
139
-
140
-
 141
141 -
 142
142 -
 143
143 -
 144
144 -
 145
145 -
 146
146 -
 147
147 -
 148
148 -
 149
149 -
 150
150 -
 151
151 -
 152
152 -
 153
153 -
 154
154 -
 155
155 -
 156
156 -
 157
157 -
 158
158 -
 159
159 -
 160
160 -
 161
161 -
162
-
163
-
164
-
165
-
166
-
167
-
168
-
169
-
170
-
171
-
172
-
173
-
174
-
175
-
176
-
177
-
178
-
179
-
180
-
181
-
182
-
183
-
184
-
185
-
186
-
187
-
188
-
189
-
190
-
191
-
192
-
193
-
194
-
195
-
196
-
197
-
198
-
199
-
200
-
201
-
202
-
203
-
204
-
205
-
206
-
207
-
208
-
209
-
210
-
211
-
212
-
213
-
214
-
215
-
216
-
217
-
218
-
219
-
220
-
221
-
222
-
223
-
224
-
225
-
226
-
227
-
228
-
229
-
230
-
231
-
232
-
233
-
234
-
235
-
236
-
237
-
238
-
239
-
240
-
241
-
242
-
243
-
244
-
245
-
246
-
247
-
248
-
249
-
250
-
251
-
252
-
253
-
254
-
255
-
256
-
257
-
258
-
259
-
260
-
261
-
262
-
263
-
264
-
265
-
266
-
267
-
268
-
269
-
270
-
271
-
272
-
273
-
274
-
275
-
276
-
277
-
278
-
279
-
280
-
281
-
282
-
283
-
284
-
285
-
286
-
287
-
288
-
289
-
290
-
291
-
292
 |
 |

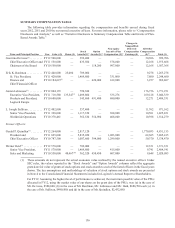
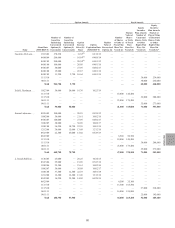
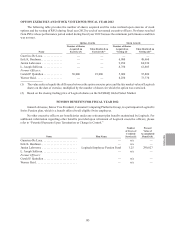
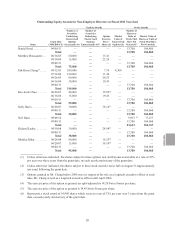
Option Awards Stock Awards
Name
Grant Date
(MM/DD/YY)
Number of
Securities
Underlying
Unexercised
Options (#)
Exercisable
Number of
Securities
Underlying
Unexercised
Options (#)
Unexercisable
Option
Exercise
Price ($) /
Share
Option
Expiration Date
(MM/DD/YY)
Market
Value of
Unexercised
Options ($)
Number
of Shares
or Units of
Stock That
Have Not
Vested (#)
Market
Value of
Shares
or Units
of Stock
That
Have Not
Vested ($)
Equity
Incentive
Plan Awards:
Number of
Unearned
Shares, Units
or Other
Rights That
Have Not
Vest e d (#)
Equity
Incentive
Plan Awards:
Market or
Payout Value
of Unearned
Shares, Units
or Other
Rights That
Have Not
Vested ($)(1)
Guerrino De Luca ... 10/16/02 370,538 — 11.35(2) 04/16/13 — — — — —
04/08/04 200,000 — 16.84(3) 04/08/14 — — — — —
04/01/05 200,000 — 20.54(4) 04/01/15 — — — — —
04/01/06 100,000 — 20.05 04/01/16 — — — — —
04/02/07 50,000 — 27.95 04/02/17 — — — — —
04/01/08 15,000 — 26.67 04/01/18 — — — — —
04/01/09 11,250 3,750 10.64 04/01/19 — — — — —
11/15/10 — — — — — — — 30,000 234,000
04/11/11 — — — — — — — 30,000 234,000
Total 946,788 3,750 — — 60,000 468,000
Erik K. Bardman . . . 10/23/09 50,000 50,000 18.76 10/23/19 — — — — —
11/15/10 — — — — — 18,000 140,400 — —
11/15/10 — — — — — — — 36,000 280,800
04/11/11 — — — — — 23,000 179,400 — —
04/11/11 — — — — — — — 35,000 273,000
Total 50,000 50,000 41,000 319,800 71,000 553,800
Junien Labrousse . . . 09/26/05 100,000 — 20.25 09/26/15 — — — — —
10/02/06 50,000 — 21.61 10/02/16 — — — — —
04/02/07 140,000 — 27.95 04/02/17 — — — — —
10/02/07 50,000 — 30.09 10/02/17 — — — — —
10/01/08 56,250 18,750 22.59 10/01/18 — — — — —
12/12/08 30,000 15,000 13.48 12/12/18 — — — — —
06/29/09 22,500 45,000 14.02 06/29/19 — — — — —
06/29/09 — — — — — 6,500 50,700 — —
11/15/10 — — — — — 18,000 140,400 — —
11/15/10 — — — — — — — 36,000 280,800
04/11/11 — — — — — 23,000 179,400 — —
04/11/11 — — — — — — — 35,000 273,000
Total 448,750 78,750 47,500 370,500 71,000 553,800
L. Joseph Sullivan ... 11/02/05 25,000 — 20.25 10/24/15 — — — — —
03/23/06 25,000 — 19.96 03/23/16 — — — — —
10/02/06 22,500 — 21.61 10/02/16 — — — — —
10/02/07 50,000 — 30.09 10/02/17 — — — — —
10/01/08 37,500 12,500 22.59 10/01/18 — — — — —
12/12/08 12,500 12,500 13.48 12/12/18 — — — — —
06/29/09 16,250 32,500 14.02 06/29/19 — — — — —
06/29/09 — — — — — 4,500 35,100 — —
11/15/10 — — — — — 13,500 105,300 — —
11/15/10 — — — — — — — 27,000 210,600
04/11/11 — — — — — 16,000 124,800 — —
04/11/11 — — — — — — — 25,000 195,000
Total 188,750 57,500 34,000 265,200 52,000 405,600
ENGLISH
141