Logitech 2012 Annual Report Download - page 171
Download and view the complete annual report
Please find page 171 of the 2012 Logitech annual report below. You can navigate through the pages in the report by either clicking on the pages listed below, or by using the keyword search tool below to find specific information within the annual report.-
 1
1 -
2
-
3
-
4
-
5
-
6
-
7
-
8
-
9
-
10
-
11
-
12
-
13
-
14
-
15
-
16
-
17
-
18
-
19
-
20
-
21
-
22
-
23
-
24
-
25
-
26
-
27
-
28
-
29
-
30
-
31
-
32
-
33
-
34
-
35
-
36
-
37
-
38
-
39
-
40
-
41
-
42
-
43
-
44
-
45
-
46
-
47
-
48
-
49
-
50
-
51
-
52
-
53
-
54
-
55
-
56
-
57
-
58
-
59
-
60
-
61
-
62
-
63
-
64
-
65
-
66
-
67
-
68
-
69
-
70
-
71
-
72
-
73
-
74
-
75
-
76
-
77
-
78
-
79
-
80
-
81
-
82
-
83
-
84
-
85
-
86
-
87
-
88
-
89
-
90
-
91
-
92
-
93
-
94
-
95
-
96
-
97
-
98
-
99
-
100
-
101
-
102
-
103
-
104
-
105
-
106
-
107
-
108
-
109
-
110
-
111
-
112
-
113
-
114
-
115
-
116
-
117
-
118
-
119
-
120
-
121
-
122
-
123
-
124
-
125
-
126
-
127
-
128
-
129
-
130
-
131
-
132
-
133
-
134
-
135
-
136
-
137
-
138
-
139
-
140
-
141
-
142
-
143
-
144
-
145
-
146
-
147
-
148
-
149
-
150
-
151
-
152
-
153
-
154
-
155
-
156
-
157
-
158
-
159
-
160
-
 161
161 -
 162
162 -
 163
163 -
 164
164 -
 165
165 -
 166
166 -
 167
167 -
 168
168 -
 169
169 -
 170
170 -
 171
171 -
 172
172 -
 173
173 -
 174
174 -
 175
175 -
 176
176 -
 177
177 -
 178
178 -
 179
179 -
 180
180 -
 181
181 -
182
-
183
-
184
-
185
-
186
-
187
-
188
-
189
-
190
-
191
-
192
-
193
-
194
-
195
-
196
-
197
-
198
-
199
-
200
-
201
-
202
-
203
-
204
-
205
-
206
-
207
-
208
-
209
-
210
-
211
-
212
-
213
-
214
-
215
-
216
-
217
-
218
-
219
-
220
-
221
-
222
-
223
-
224
-
225
-
226
-
227
-
228
-
229
-
230
-
231
-
232
-
233
-
234
-
235
-
236
-
237
-
238
-
239
-
240
-
241
-
242
-
243
-
244
-
245
-
246
-
247
-
248
-
249
-
250
-
251
-
252
-
253
-
254
-
255
-
256
-
257
-
258
-
259
-
260
-
261
-
262
-
263
-
264
-
265
-
266
-
267
-
268
-
269
-
270
-
271
-
272
-
273
-
274
-
275
-
276
-
277
-
278
-
279
-
280
-
281
-
282
-
283
-
284
-
285
-
286
-
287
-
288
-
289
-
290
-
291
-
292
 |
 |

Our balance sheet includes goodwill of $220.9 million related to various past acquisitions which are part of
our peripherals reporting unit, and $339.7 million related to our video conferencing reporting unit. We perform our
annual goodwill impairment test annually as of December 31, or more frequently, if certain events or circumstances
warrant. Events or changes in circumstances which might indicate potential impairment in goodwill include the
company specific factors described in our Form 10-K, volatility in stock price, a sustained decline in market
capitalization relative to net book value, and lower than projected revenue, market growth, or operating results.
Management performed a goodwill impairment analysis, as described in Note 9 to our consolidated financial
statements, of each of our reporting units as of December 31, 2011, and determined that the fair value of our
peripherals reporting unit exceeded the carrying value of the reporting unit by more than 30% of the carrying
value, and the fair value of our video conferencing reporting unit exceeded the carrying value of the reporting
unit by more than 80% of the carrying value. Management continues to evaluate and monitor all key factors
impacting the carrying value of our recorded goodwill, as well as other long lived assets. Adverse changes in the
Company’s expected operating results, market capitalization, business climate, or other negative events could result
in a material non-cash impairment charge in the future.
Most of our revenue comes from sales to our retail channels, which resell to consumers, retailers and
distributors. As a result, our customers’ demand for our products depends in substantial part on trends in consumer
confidence and consumer spending, as well as the levels of inventory which our customers, and their customers,
choose to maintain. We use sell-through data, which represents sales of our products by our retailer customers
to consumers, and by our distributor customers to their customers, along with other metrics to assess consumer
demand for our products. Sell-through data is subject to limitations due to collection methods and the third party
nature of the data and thus may not be an accurate indicator of actual consumer demand for our products. In
addition, the customers supplying sell-through data vary by geographic region and from period to period, but
typically represent a majority of our retail sales.
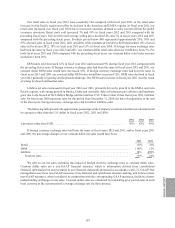
Although our financial results are reported in U.S. dollars, approximately 45% of our sales for the fiscal year
ended March 31, 2012 were made in currencies other than the U.S. dollar, such as the euro, Chinese renminbi,
Japanese yen, Canadian dollar and Australian dollar. Our product costs are primarily in U.S. dollars and Chinese
renminbi. Our operating expenses are incurred in U.S. dollars, Chinese renminbi, Swiss francs, euros, and, to a
lesser extent, 29 other currencies. To the extent that the U.S. dollar significantly increases or decreases in value
relative to the currencies in which our sales and operating expenses are denominated, the reported dollar amounts
of our sales and expenses may decrease or increase.
Our gross margins vary with the mix of products sold, competitive activity, product life cycle, new product
introductions, unit volumes, commodity and supply chain costs, foreign currency exchange rate fluctuations,
geographic sales mix, and the complexity and functionality of new product introductions. Changes in consumer
demand affect the need for us to undertake promotional efforts, such as cooperative marketing arrangements,
customer incentive programs or other pricing programs, which alter our product gross margins. Gross margins
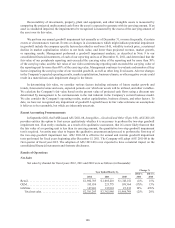
for the fiscal year ended March 31, 2012 were 33.5%, compared with 35.4% in fiscal year 2011, primarily due to
increased manufacturing and distribution costs, a $34.1 million inventory valuation adjustment related to Logitech
Revue and related peripherals, and an unfavorable shift in retail product mix towards products with lower average
selling prices.
Logitech is incorporated in Switzerland but operates in various countries with differing tax laws and rates.
A portion of our income before taxes and the provision for income taxes are generated outside of Switzerland.
Therefore, our effective income tax rate depends on the amount of profits generated in each of the various tax
jurisdictions in which we operate. For the fiscal years ended March 31, 2012 and 2011, the income tax provisions
were $19.8 million and $20.0 million based on effective income tax rates of 21.7% and 13.5% of pre-tax income. The
change in the effective income tax rate for the fiscal year ended March 31, 2012 compared with 2011 was primarily
due to the mix of income and losses in the various tax jurisdictions in which the Company operates, and a discrete
tax benefit of $7.2 million in fiscal year ended March 31, 2011 for the closure of income tax audits in certain
ANNUAL REPORT
161