Logitech 2012 Annual Report Download - page 168
Download and view the complete annual report
Please find page 168 of the 2012 Logitech annual report below. You can navigate through the pages in the report by either clicking on the pages listed below, or by using the keyword search tool below to find specific information within the annual report.-
 1
1 -
2
-
3
-
4
-
5
-
6
-
7
-
8
-
9
-
10
-
11
-
12
-
13
-
14
-
15
-
16
-
17
-
18
-
19
-
20
-
21
-
22
-
23
-
24
-
25
-
26
-
27
-
28
-
29
-
30
-
31
-
32
-
33
-
34
-
35
-
36
-
37
-
38
-
39
-
40
-
41
-
42
-
43
-
44
-
45
-
46
-
47
-
48
-
49
-
50
-
51
-
52
-
53
-
54
-
55
-
56
-
57
-
58
-
59
-
60
-
61
-
62
-
63
-
64
-
65
-
66
-
67
-
68
-
69
-
70
-
71
-
72
-
73
-
74
-
75
-
76
-
77
-
78
-
79
-
80
-
81
-
82
-
83
-
84
-
85
-
86
-
87
-
88
-
89
-
90
-
91
-
92
-
93
-
94
-
95
-
96
-
97
-
98
-
99
-
100
-
101
-
102
-
103
-
104
-
105
-
106
-
107
-
108
-
109
-
110
-
111
-
112
-
113
-
114
-
115
-
116
-
117
-
118
-
119
-
120
-
121
-
122
-
123
-
124
-
125
-
126
-
127
-
128
-
129
-
130
-
131
-
132
-
133
-
134
-
135
-
136
-
137
-
138
-
139
-
140
-
141
-
142
-
143
-
144
-
145
-
146
-
147
-
148
-
149
-
150
-
151
-
152
-
153
-
154
-
155
-
156
-
157
-
 158
158 -
 159
159 -
 160
160 -
 161
161 -
 162
162 -
 163
163 -
 164
164 -
 165
165 -
 166
166 -
 167
167 -
 168
168 -
 169
169 -
 170
170 -
 171
171 -
 172
172 -
 173
173 -
 174
174 -
 175
175 -
 176
176 -
 177
177 -
 178
178 -
179
-
180
-
181
-
182
-
183
-
184
-
185
-
186
-
187
-
188
-
189
-
190
-
191
-
192
-
193
-
194
-
195
-
196
-
197
-
198
-
199
-
200
-
201
-
202
-
203
-
204
-
205
-
206
-
207
-
208
-
209
-
210
-
211
-
212
-
213
-
214
-
215
-
216
-
217
-
218
-
219
-
220
-
221
-
222
-
223
-
224
-
225
-
226
-
227
-
228
-
229
-
230
-
231
-
232
-
233
-
234
-
235
-
236
-
237
-
238
-
239
-
240
-
241
-
242
-
243
-
244
-
245
-
246
-
247
-
248
-
249
-
250
-
251
-
252
-
253
-
254
-
255
-
256
-
257
-
258
-
259
-
260
-
261
-
262
-
263
-
264
-
265
-
266
-
267
-
268
-
269
-
270
-
271
-
272
-
273
-
274
-
275
-
276
-
277
-
278
-
279
-
280
-
281
-
282
-
283
-
284
-
285
-
286
-
287
-
288
-
289
-
290
-
291
-
292
 |
 |
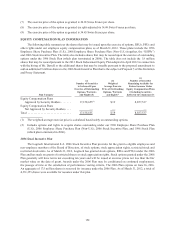
webcam and video communications groups. We sell our LifeSize products and services to distributors, value-added
resellers, OEMs, and, occasionally, direct enterprise customers. Sales of LifeSize products were 6% of our net sales
in the fiscal years ended March 31, 2012 and 2011.
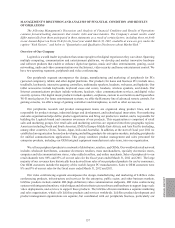
We seek to fulfill the increasing demand for interfaces between people and the expanding digital world
across multiple platforms and user environments. The interface evolves as platforms, user models and our target
markets evolve. As access to digital information has expanded, we have extended our focus to mobile devices,
the digital home, and the enterprise as access points to the Internet and the digital world. All of these platforms
require interfaces that are customized according to how the devices are used. We believe that continued investment
in product research and development is critical to creating the innovation required to strengthen our competitive
advantage and to drive future sales growth. We are committed to identifying and meeting current and future
customer trends with new and improved product technologies, partnering with others where our strengths are
complementary, as well as leveraging the value of the Logitech and LifeSize brands from a competitive, channel
partner and consumer experience perspective. We believe innovation and product quality are important to gaining
market acceptance and maintaining market leadership.
We are developing new categories of products, such as tablet accessories, expanding in emerging retail
markets, such as China, Russia, India and Latin America, increasing our presence in digital music, and entering
new product arenas, such as hosted video conferencing as a service, and peripherals and services for UC (unified
communications). As we do so, we are confronting new competitors, many of which have more experience in the
categories or markets and have greater marketing resources and brand name recognition than we have. In addition,
because of the continuing convergence of the markets for computing devices and consumer electronics, we expect
greater competition in the future from well-established consumer electronics companies in our new categories as
well as future ones we might enter. Many of these companies have greater financial, technical, sales, marketing and
other resources than we have.
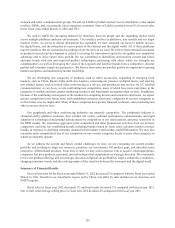
Our peripherals and video conferencing industries are intensely competitive. The peripherals industry is
characterized by platform evolution, short product life cycles, continual performance enhancements, and rapid
adoption of technological and product advancements by competitors in our retail markets, and price sensitivity in
the OEM market. We experience aggressive price competition and other promotional activities from our primary
competitors and from less established brands, including brands owned by some retail customers known as house
brands, in response to declining consumer demand in both mature retail markets and OEM markets. We may also
encounter more competition if any of our competitors in one or more categories decide to enter other categories in
which we currently operate.
As we address the current and future market challenges we face, we are evaluating our current product
portfolio and roadmap to align our resources, prioritize our investments, fill product gaps, and introduce more
innovative, differentiated products. From time to time, we may seek to partner with or acquire, when appropriate,
companies that have products, personnel, and technologies that complement our strategic direction. We continually
review our product offerings and our strategic direction in light of our profitability targets, competitive conditions,
changing consumer trends, and the evolving nature of the interface between the consumer and the digital world.
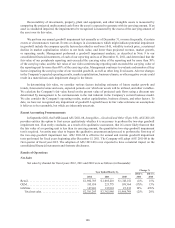
Summary of Financial Results
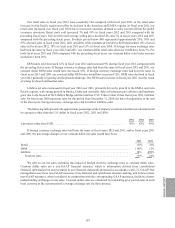
Our total net sales for the fiscal year ended March 31, 2012 decreased 2% compared with the fiscal year ended
March 31, 2011. Growth in our Asia Pacific region, led by China, was offset by sales declines in our Americas and
EMEA regions.
Retail sales in fiscal year 2012 decreased 1% and retail units increased 3% compared with fiscal year 2011.
Our overall retail average selling price in fiscal year 2012 declined 4% compared with fiscal year 2011.
158