Logitech 2012 Annual Report Download - page 246
Download and view the complete annual report
Please find page 246 of the 2012 Logitech annual report below. You can navigate through the pages in the report by either clicking on the pages listed below, or by using the keyword search tool below to find specific information within the annual report.-
 1
1 -
2
-
3
-
4
-
5
-
6
-
7
-
8
-
9
-
10
-
11
-
12
-
13
-
14
-
15
-
16
-
17
-
18
-
19
-
20
-
21
-
22
-
23
-
24
-
25
-
26
-
27
-
28
-
29
-
30
-
31
-
32
-
33
-
34
-
35
-
36
-
37
-
38
-
39
-
40
-
41
-
42
-
43
-
44
-
45
-
46
-
47
-
48
-
49
-
50
-
51
-
52
-
53
-
54
-
55
-
56
-
57
-
58
-
59
-
60
-
61
-
62
-
63
-
64
-
65
-
66
-
67
-
68
-
69
-
70
-
71
-
72
-
73
-
74
-
75
-
76
-
77
-
78
-
79
-
80
-
81
-
82
-
83
-
84
-
85
-
86
-
87
-
88
-
89
-
90
-
91
-
92
-
93
-
94
-
95
-
96
-
97
-
98
-
99
-
100
-
101
-
102
-
103
-
104
-
105
-
106
-
107
-
108
-
109
-
110
-
111
-
112
-
113
-
114
-
115
-
116
-
117
-
118
-
119
-
120
-
121
-
122
-
123
-
124
-
125
-
126
-
127
-
128
-
129
-
130
-
131
-
132
-
133
-
134
-
135
-
136
-
137
-
138
-
139
-
140
-
141
-
142
-
143
-
144
-
145
-
146
-
147
-
148
-
149
-
150
-
151
-
152
-
153
-
154
-
155
-
156
-
157
-
158
-
159
-
160
-
161
-
162
-
163
-
164
-
165
-
166
-
167
-
168
-
169
-
170
-
171
-
172
-
173
-
174
-
175
-
176
-
177
-
178
-
179
-
180
-
181
-
182
-
183
-
184
-
185
-
186
-
187
-
188
-
189
-
190
-
191
-
192
-
193
-
194
-
195
-
196
-
197
-
198
-
199
-
200
-
201
-
202
-
203
-
204
-
205
-
206
-
207
-
208
-
209
-
210
-
211
-
212
-
213
-
214
-
215
-
216
-
217
-
218
-
219
-
220
-
221
-
222
-
223
-
224
-
225
-
226
-
227
-
228
-
229
-
230
-
231
-
232
-
233
-
234
-
235
-
 236
236 -
 237
237 -
 238
238 -
 239
239 -
 240
240 -
 241
241 -
 242
242 -
 243
243 -
 244
244 -
 245
245 -
 246
246 -
 247
247 -
 248
248 -
 249
249 -
 250
250 -
 251
251 -
 252
252 -
 253
253 -
 254
254 -
 255
255 -
 256
256 -
257
-
258
-
259
-
260
-
261
-
262
-
263
-
264
-
265
-
266
-
267
-
268
-
269
-
270
-
271
-
272
-
273
-
274
-
275
-
276
-
277
-
278
-
279
-
280
-
281
-
282
-
283
-
284
-
285
-
286
-
287
-
288
-
289
-
290
-
291
-
292
 |
 |

LOGITECH INTERNATIONAL S.A.
NOTES TO CONSOLIDATED FINANCIAL STATEMENTS (Continued)
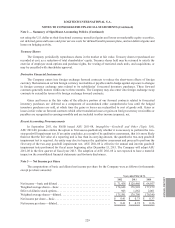
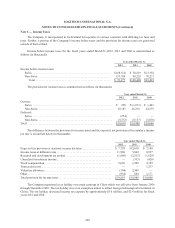
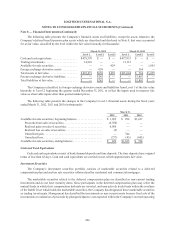
The accumulated benefit obligation for all defined benefit pension plans as of March 31, 2012 and 2011 was
$72.8 million and $60.2 million.
The following table presents the changes in the fair value of defined benefit pension plan assets for fiscal
years 2012 and 2011 (in thousands):
March 31,
2012 2011
Fair value of plan assets, beginning of year ......................... $45,937 $35,427
Actual return on plan assets . . . . . . . . . . . . . . . . . . . . . . . . . . . . . . . . . . 219 34
Employer contributions ...................................... 5,071 4,612
Plan participant contributions . . . . . . . . . . . . . . . . . . . . . . . . . . . . . . . . . 2,878 2,321
Benefits paid .............................................. (3,812) (2,220)
Settlement ................................................ — (85)
Administrative expenses paid . . . . . . . . . . . . . . . . . . . . . . . . . . . . . . . . . (197) (131)
Foreign currency exchange rate changes . . . . . . . . . . . . . . . . . . . . . . . . 573 5,979
Fair value of plan assets, end of year . . . . . . . . . . . . . . . . . . . . . . . . . . . . . . $50,669 $45,937
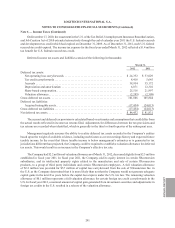
The Company’s investment objectives are to ensure that the assets of its defined benefit plans are invested to
provide an optimal rate of investment return on the total investment portfolio, consistent with the assumption of a
reasonable risk level, and to ensure that pension funds are available to meet the plans’ benefit obligations as they
become due. The Company believes that a well-diversified investment portfolio will result in the highest attainable
investment return with an acceptable level of overall risk. Investment strategies and allocation decisions are also
governed by applicable governmental regulatory agencies. The Company’s investment strategy with respect to its
largest defined benefit plan, which is available only to Swiss employees, is to invest in the following allocation
ranges: 28 - 43% for equities, 33-63% for Swiss bonds, 5-15% for foreign bonds, 5-15% for hedge and investment
funds, and 0-20% for cash and cash equivalents. The Company’s other defined benefit plans, which comprise
approximately 2% of total defined benefit plan assets as of March 31, 2012, have similar investment and allocation
strategies. The following tables present the fair value of the defined benefit pension plan assets by major categories
and by levels within the fair value hierarchy as of March 31, 2012 and 2011 (in thousands):
March 31, 2012
Level 1 Level 2 Level 3 Tot al
Cash ....................................... $ 2,675 $ — $— $ 2,675
Equity securities .............................. 17,513 — — 17,513
Debt securities . . . . . . . . . . . . . . . . . . . . . . . . . . . . . . . 22,892 — — 22,892
Swiss real estate fund .......................... 3,561 — — 3,561
Hedge fund .................................. — 3,167 — 3,167
Commodity fund. . . . . . . . . . . . . . . . . . . . . . . . . . . . . . 590 — — 590
Other ....................................... — 271 — 271
Total plan assets at fair value . . . . . . . . . . . . . . . . . . . . $47,231 $ 3,438 $ — $50,669
Note 4 — Employee Benefit Plans (Continued)
236