Logitech 2012 Annual Report Download - page 201
Download and view the complete annual report
Please find page 201 of the 2012 Logitech annual report below. You can navigate through the pages in the report by either clicking on the pages listed below, or by using the keyword search tool below to find specific information within the annual report.-
 1
1 -
2
-
3
-
4
-
5
-
6
-
7
-
8
-
9
-
10
-
11
-
12
-
13
-
14
-
15
-
16
-
17
-
18
-
19
-
20
-
21
-
22
-
23
-
24
-
25
-
26
-
27
-
28
-
29
-
30
-
31
-
32
-
33
-
34
-
35
-
36
-
37
-
38
-
39
-
40
-
41
-
42
-
43
-
44
-
45
-
46
-
47
-
48
-
49
-
50
-
51
-
52
-
53
-
54
-
55
-
56
-
57
-
58
-
59
-
60
-
61
-
62
-
63
-
64
-
65
-
66
-
67
-
68
-
69
-
70
-
71
-
72
-
73
-
74
-
75
-
76
-
77
-
78
-
79
-
80
-
81
-
82
-
83
-
84
-
85
-
86
-
87
-
88
-
89
-
90
-
91
-
92
-
93
-
94
-
95
-
96
-
97
-
98
-
99
-
100
-
101
-
102
-
103
-
104
-
105
-
106
-
107
-
108
-
109
-
110
-
111
-
112
-
113
-
114
-
115
-
116
-
117
-
118
-
119
-
120
-
121
-
122
-
123
-
124
-
125
-
126
-
127
-
128
-
129
-
130
-
131
-
132
-
133
-
134
-
135
-
136
-
137
-
138
-
139
-
140
-
141
-
142
-
143
-
144
-
145
-
146
-
147
-
148
-
149
-
150
-
151
-
152
-
153
-
154
-
155
-
156
-
157
-
158
-
159
-
160
-
161
-
162
-
163
-
164
-
165
-
166
-
167
-
168
-
169
-
170
-
171
-
172
-
173
-
174
-
175
-
176
-
177
-
178
-
179
-
180
-
181
-
182
-
183
-
184
-
185
-
186
-
187
-
188
-
189
-
190
-
 191
191 -
 192
192 -
 193
193 -
 194
194 -
 195
195 -
 196
196 -
 197
197 -
 198
198 -
 199
199 -
 200
200 -
 201
201 -
 202
202 -
 203
203 -
 204
204 -
 205
205 -
 206
206 -
 207
207 -
 208
208 -
 209
209 -
 210
210 -
 211
211 -
212
-
213
-
214
-
215
-
216
-
217
-
218
-
219
-
220
-
221
-
222
-
223
-
224
-
225
-
226
-
227
-
228
-
229
-
230
-
231
-
232
-
233
-
234
-
235
-
236
-
237
-
238
-
239
-
240
-
241
-
242
-
243
-
244
-
245
-
246
-
247
-
248
-
249
-
250
-
251
-
252
-
253
-
254
-
255
-
256
-
257
-
258
-
259
-
260
-
261
-
262
-
263
-
264
-
265
-
266
-
267
-
268
-
269
-
270
-
271
-
272
-
273
-
274
-
275
-
276
-
277
-
278
-
279
-
280
-
281
-
282
-
283
-
284
-
285
-
286
-
287
-
288
-
289
-
290
-
291
-
292
 |
 |

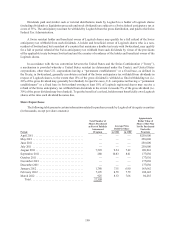
In fiscal year 2012, the following approved share buyback programs were in place (in thousands):
Date of Announcement
Approved
Share
Amount
Approved
Buyback
Amount
Expiration
Date
Completion
Date
Number
of Shares
Remaining(1)
Amount
Remaining
September 2008—amended .... 28,465 $177,030 August 2013 — 12,075 $94,255
September 2008 . . . . . . . . . . . . . 8,344 250,000 August 2013 — — —
(1) Represents an estimate of the shares remaining to be repurchased calculated based on the amount remaining
to repurchase as of March 31, 2012, $94.3 million, divided by the adjusted close price of the Company’s shares
traded on the SIX Swiss Exchange as of the same date, $7.81 per share.
The Company intends to request shareholder approval at the Company’s next Annual General Meeting
of Shareholders to cancel the 9.9 million shares repurchased under the September 2008 amended share
buyback program.
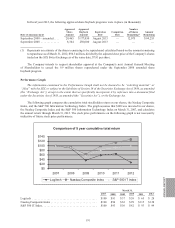
Performance Graph
The information contained in the Performance Graph shall not be deemed to be ‘‘soliciting material’’ or
‘‘ filed’’ with the SEC or subject to the liabilities of Section 18 of the Securities Exchange Act of 1934, as amended
(the ‘‘Exchange Act’’), except to the extent that we specifically incorporate it by reference into a document filed
under the Securities Act of 1933, as amended (the ‘‘Securities Act’’), or the Exchange Act.
The following graph compares the cumulative total stockholder return on our shares, the Nasdaq Composite
Index, and the S&P 500 Information Technology Index. The graph assumes that $100 was invested in our shares,
the Nasdaq Composite Index and the S&P 500 Information Technology Index on March 31, 2007, and calculates
the annual return through March 31, 2012. The stock price performance on the following graph is not necessarily
indicative of future stock price performance.
Logitech Nasdaq Composite Index S&P 500 Index
Logitech Nasdaq Composite Index S&P 500 IT Index
Comparison of 5 year cumulative total return
2007 2008 2009 2010 2011 2012
$0
$20
$40
$60
$80
$100
$120
$140
March 31,
2007 2008 2009 2010 2011 2012
Logitech ............................................. $100 $91 $37 $59 $ 65 $ 28
Nasdaq Composite Index . . . . . . . . . . . . . . . . . . . . . . . . . . . . . . . . $100 $94 $63 $ 99 $115 $128
S&P 500 IT Index ...................................... $100 $93 $56 $ 82 $ 93 $ 99
ANNUAL REPORT
191